Finance operations

Reports that took two to three minutes now return in two to five seconds

A finance team needed daily sales and returns across several marketplaces and was waiting minutes per query, then asking an engineer for extracts anyway. The fix was in the queries and the data model, not the hardware.

2–3 min → 2–5 sec

query time, on the same hardware

8.5 million

rows produced by a single join, returned in seconds

19 million

rows in the largest table involved

5 reports

across generic, Myntra-Omni and TataCliq variants

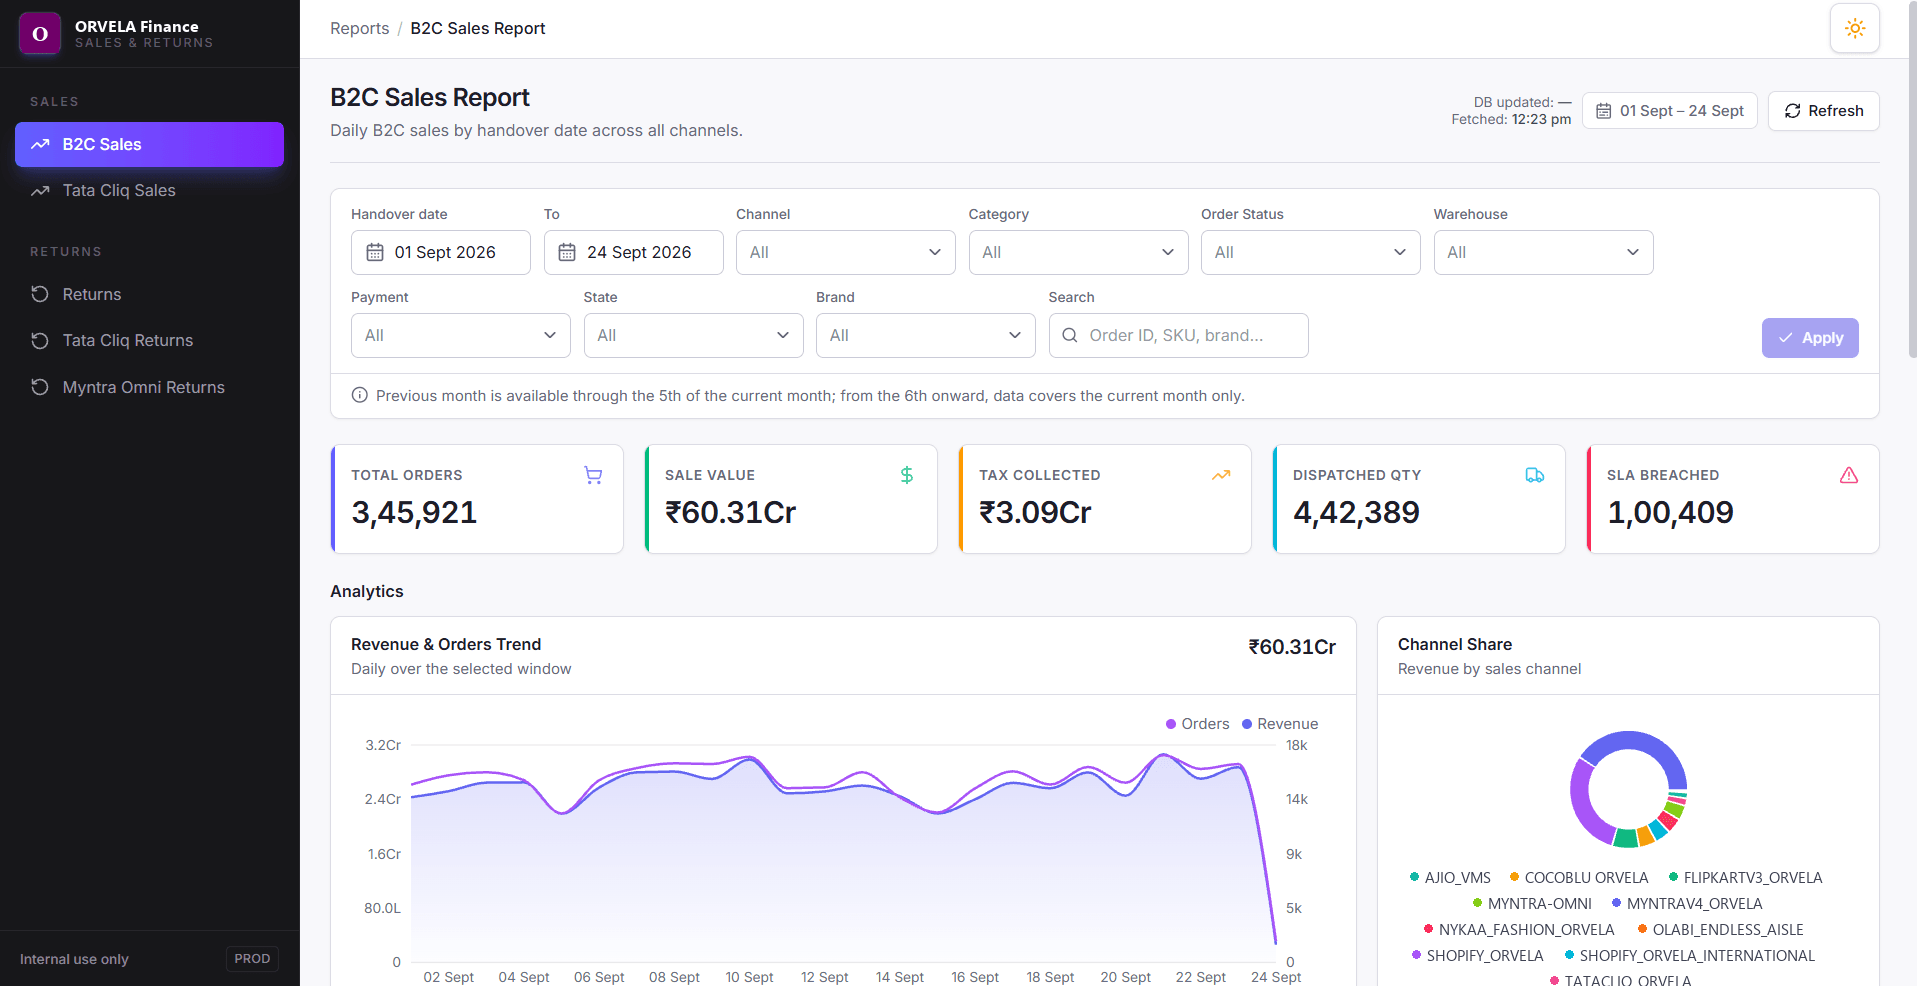
Daily sales report with filters, KPI cards for orders, sale value, tax, dispatch and SLA breaches, a revenue and orders trend and a channel share chart.

Swipe to see the full screen

The report that used to take two to three minutes, now rendering in two to five seconds.

The situation

The finance team’s daily reports were technically available and practically unusable. A query took two to three minutes, exports crashed the browser, and the workaround — asking an engineer for a CSV — put a person in the middle of a daily routine.

The underlying data was large and awkward: a time-partitioned detail table running to over a thousand daily chunks, a join that fanned 2.4 million rows out to 8.5 million, and a 19-million-row ledger behind it.

What I built

A self-serve reporting application over the existing warehouse, with the query layer rebuilt around how the data is actually shaped.

  • One grouping query per report producing the daily trend plus channel, brand, payment-mode and state breakdowns in a single pass, instead of several queries stitched together.
  • Pagination that returns whether more rows exist rather than counting all of them — a full count over a 19-million-row table costs more than the page you are reading.
  • CSV export streamed straight from a database cursor, so a large export does not hold the server’s memory while it builds.
  • Redis caching keyed on normalised query parameters, so repeated views are instant and the warehouse is not asked twice.
  • Five report variants covering the marketplaces the team actually reconciles.
ORVELA

Daybook

Sales & returns, daily

3.1s

Returns

36,466

1.8%

Return value

₹2.41 Cr

2.2%

Return rate

7.8%

0.4%

QC failed

4,118

0.9%

Reason for return

Size issue
12,840
Quality concern
8,210
Not as described
6,420
Changed mind
5,180
Damaged in transit
3,816

QC outcome

  • Back to stock71.0%
  • Refurbish18.0%
  • Write-off11.0%

Swipe to see the full screen

Returns alongside sales, so the net position is one screen rather than two exports.

Decisions worth explaining

The choice, why it was made, and what it means for you. Skip the middle part if you like — the point still lands.

01

Fix the query shape, not the hardware

The choice

The work went into how the data is joined and grouped rather than into a bigger machine.

Why

A slow report is almost always a query that asks for more than the answer needs — a count nobody reads, a join evaluated before a filter, a sort over rows that will be discarded.

What it means for you

Two to three minutes became two to five seconds on the same hardware, which means no infrastructure spend and no migration.

02

Never count what you do not display

The choice

Pagination reports whether more rows exist rather than computing a total count.

Why

On a 19-million-row table an exact total costs more than the page being displayed, and nobody reads the total.

What it means for you

The first page arrives immediately regardless of how much data sits behind it.

03

Leave the finance logic alone

The choice

The report SQL the finance team supplied was deliberately preserved rather than rewritten, with the optimisation applied around it.

Why

Their formulas encode agreed definitions. Rewriting them to be faster would have made the output faster and wrong, and the disagreement would have surfaced weeks later in a reconciliation.

What it means for you

You get the speed without having to re-audit the numbers.

For the technical readerUnder the hood
  • Node and Express backend with PostgreSQL, Redis for caching and rate limiting, and a cursor-based streaming export path.
  • React and Vite front end with RTK Query and redux-saga for server data and exports, Zustand for filter and theme state, Recharts for the charts.
  • Documented index recommendations handed to the DBA alongside the application changes, since some of the win belongs in the database rather than the app.

What it changed

  • The finance team stopped asking for extracts and started pulling their own.
  • A daily routine that involved waiting became one that does not.

Where this applies to you

If your existing reports time out, your exports crash the browser, or a page takes minutes, that is usually fixable without replacing anything. This applies to any reporting layer sitting on tables that have outgrown the queries written for them.

Screenshots show the real interface with sample figures. Timings are measured on the client’s own hardware, before and after.

Tell me what’s slow, manual, or unreliable.

Twenty minutes on a call is usually enough for me to tell you whether software is the answer and roughly what it would cost. If it isn’t, I’ll say so.

Available for freelance builds alongside senior engineering work. One or two projects at a time.