Retail operations · 50+ stores
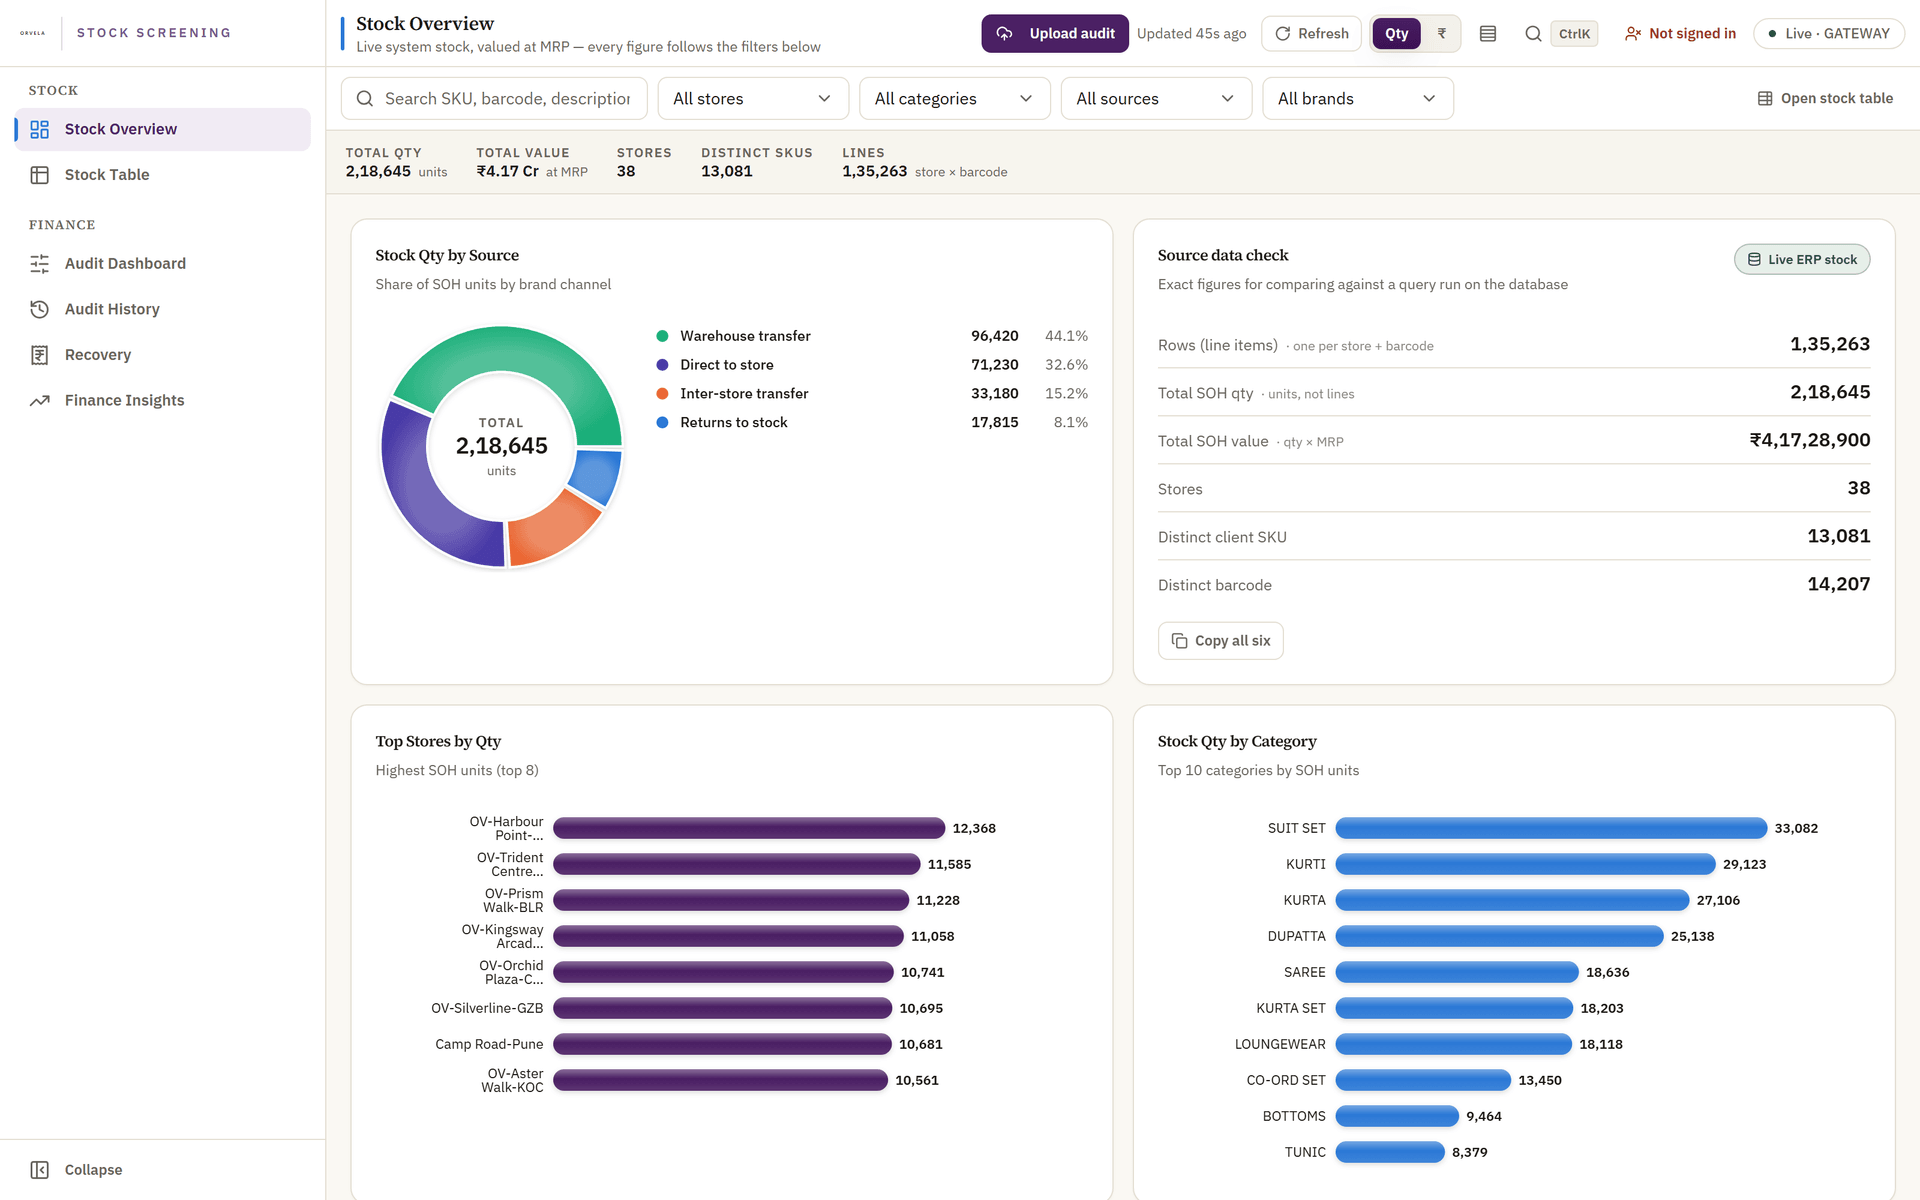
Stocktake
Store stock screening and physical-audit reconciliation, with the recovery policy applied as written.
Work
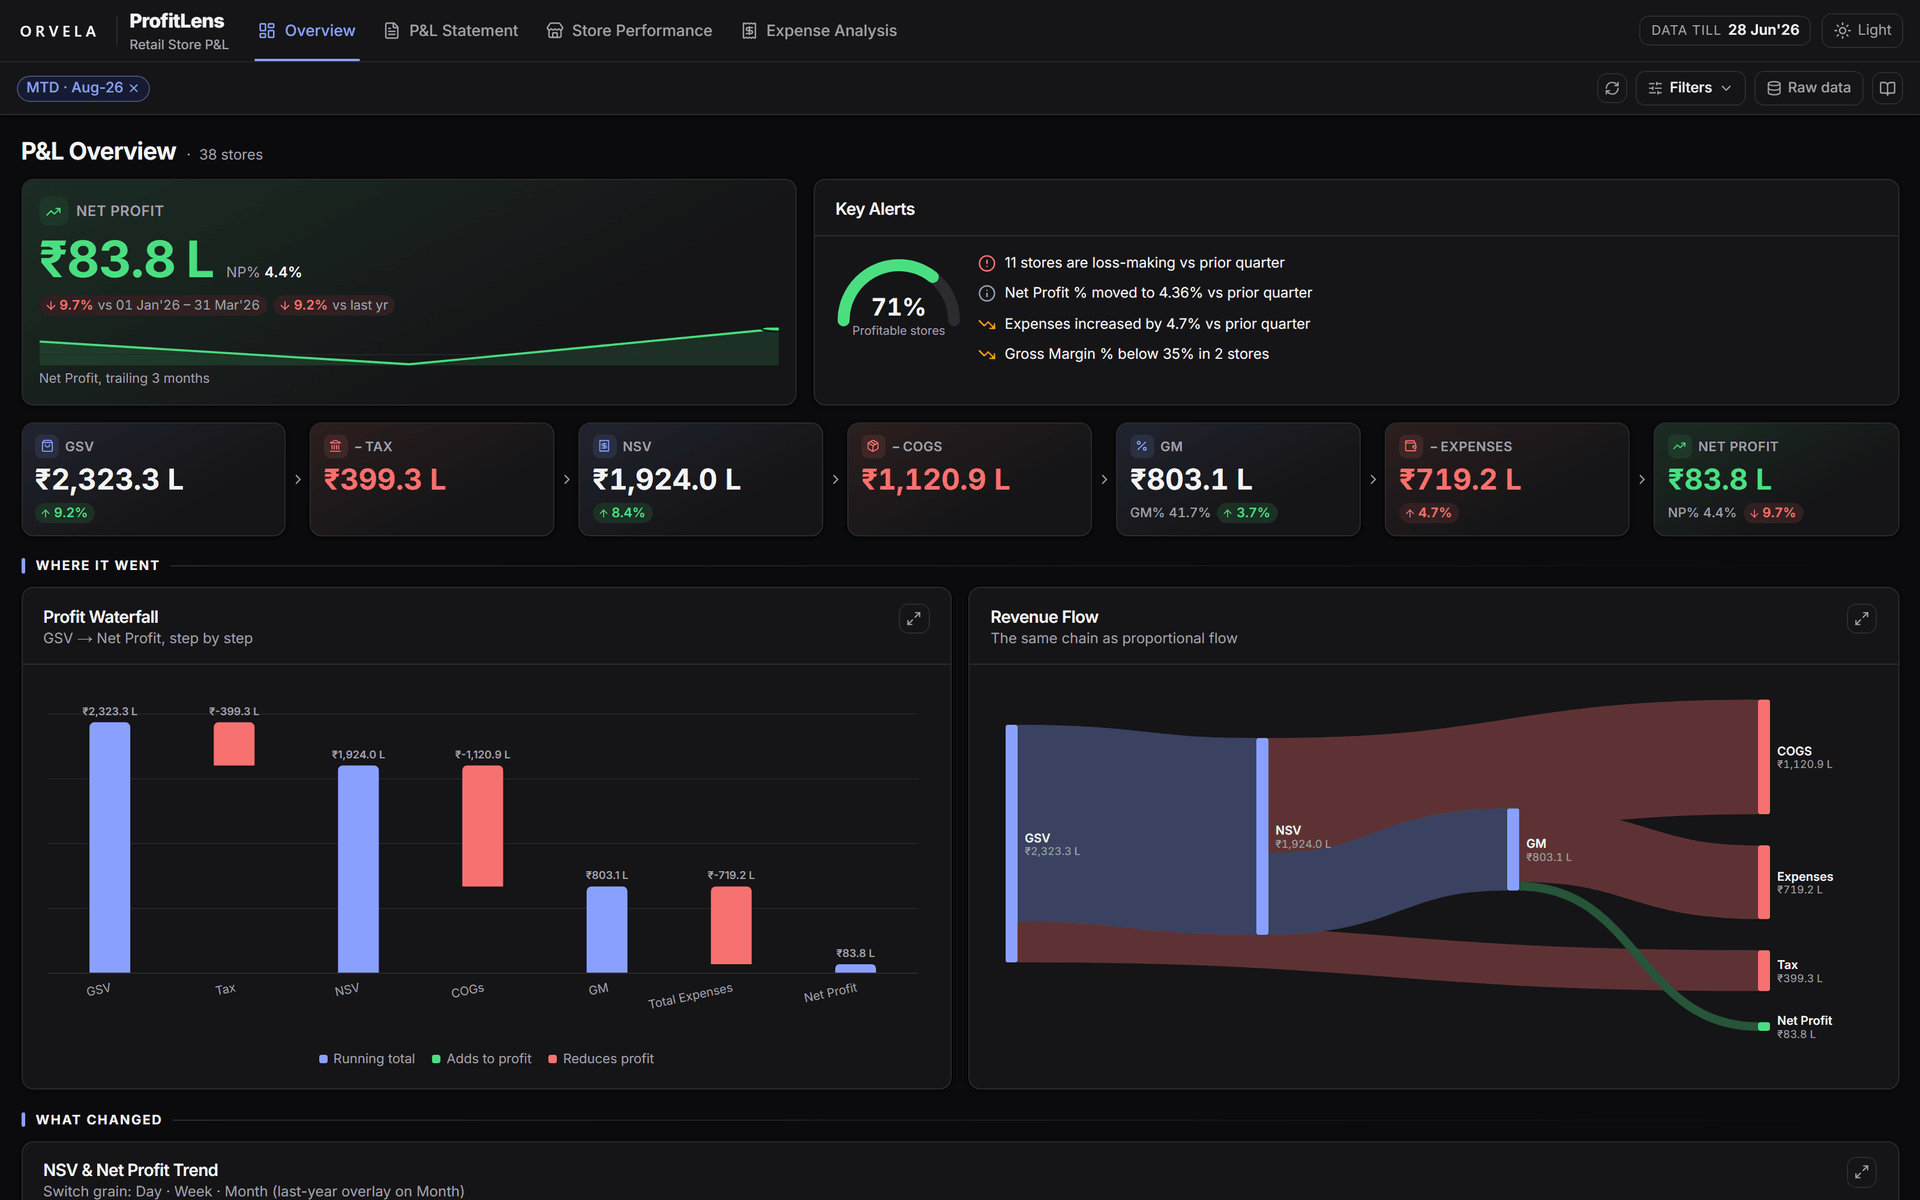
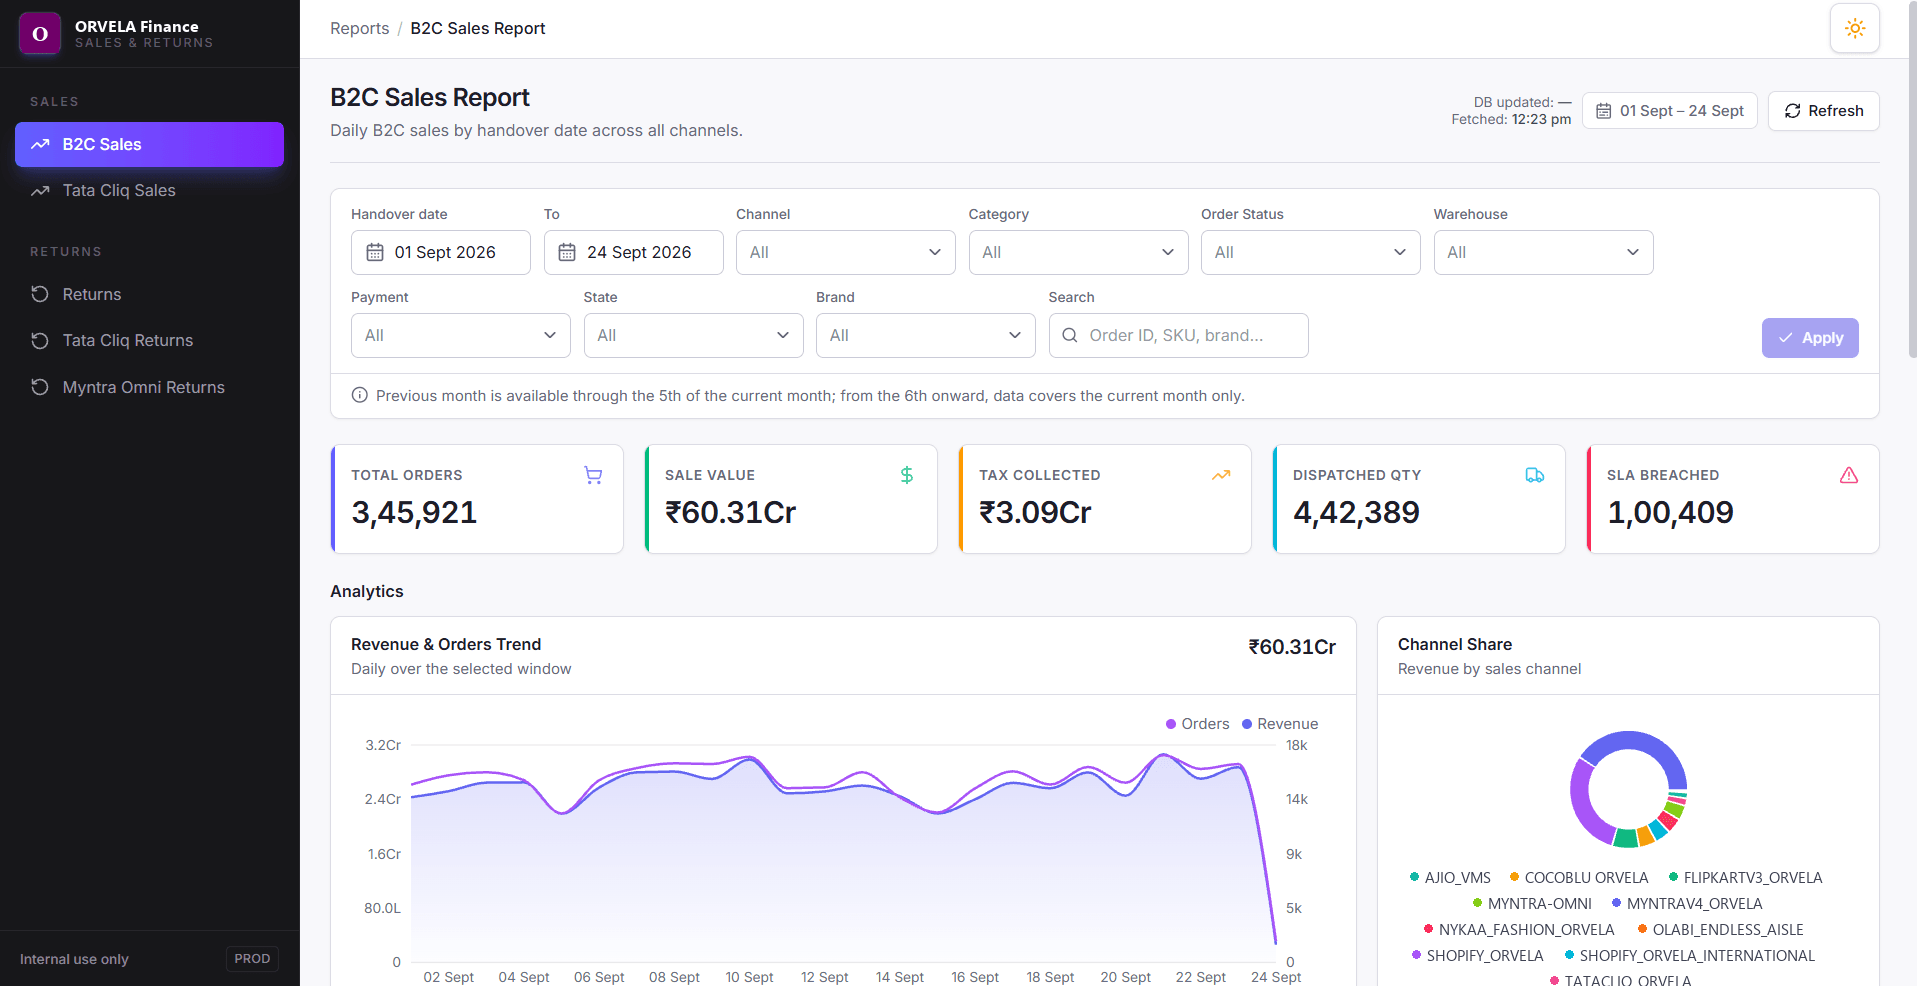
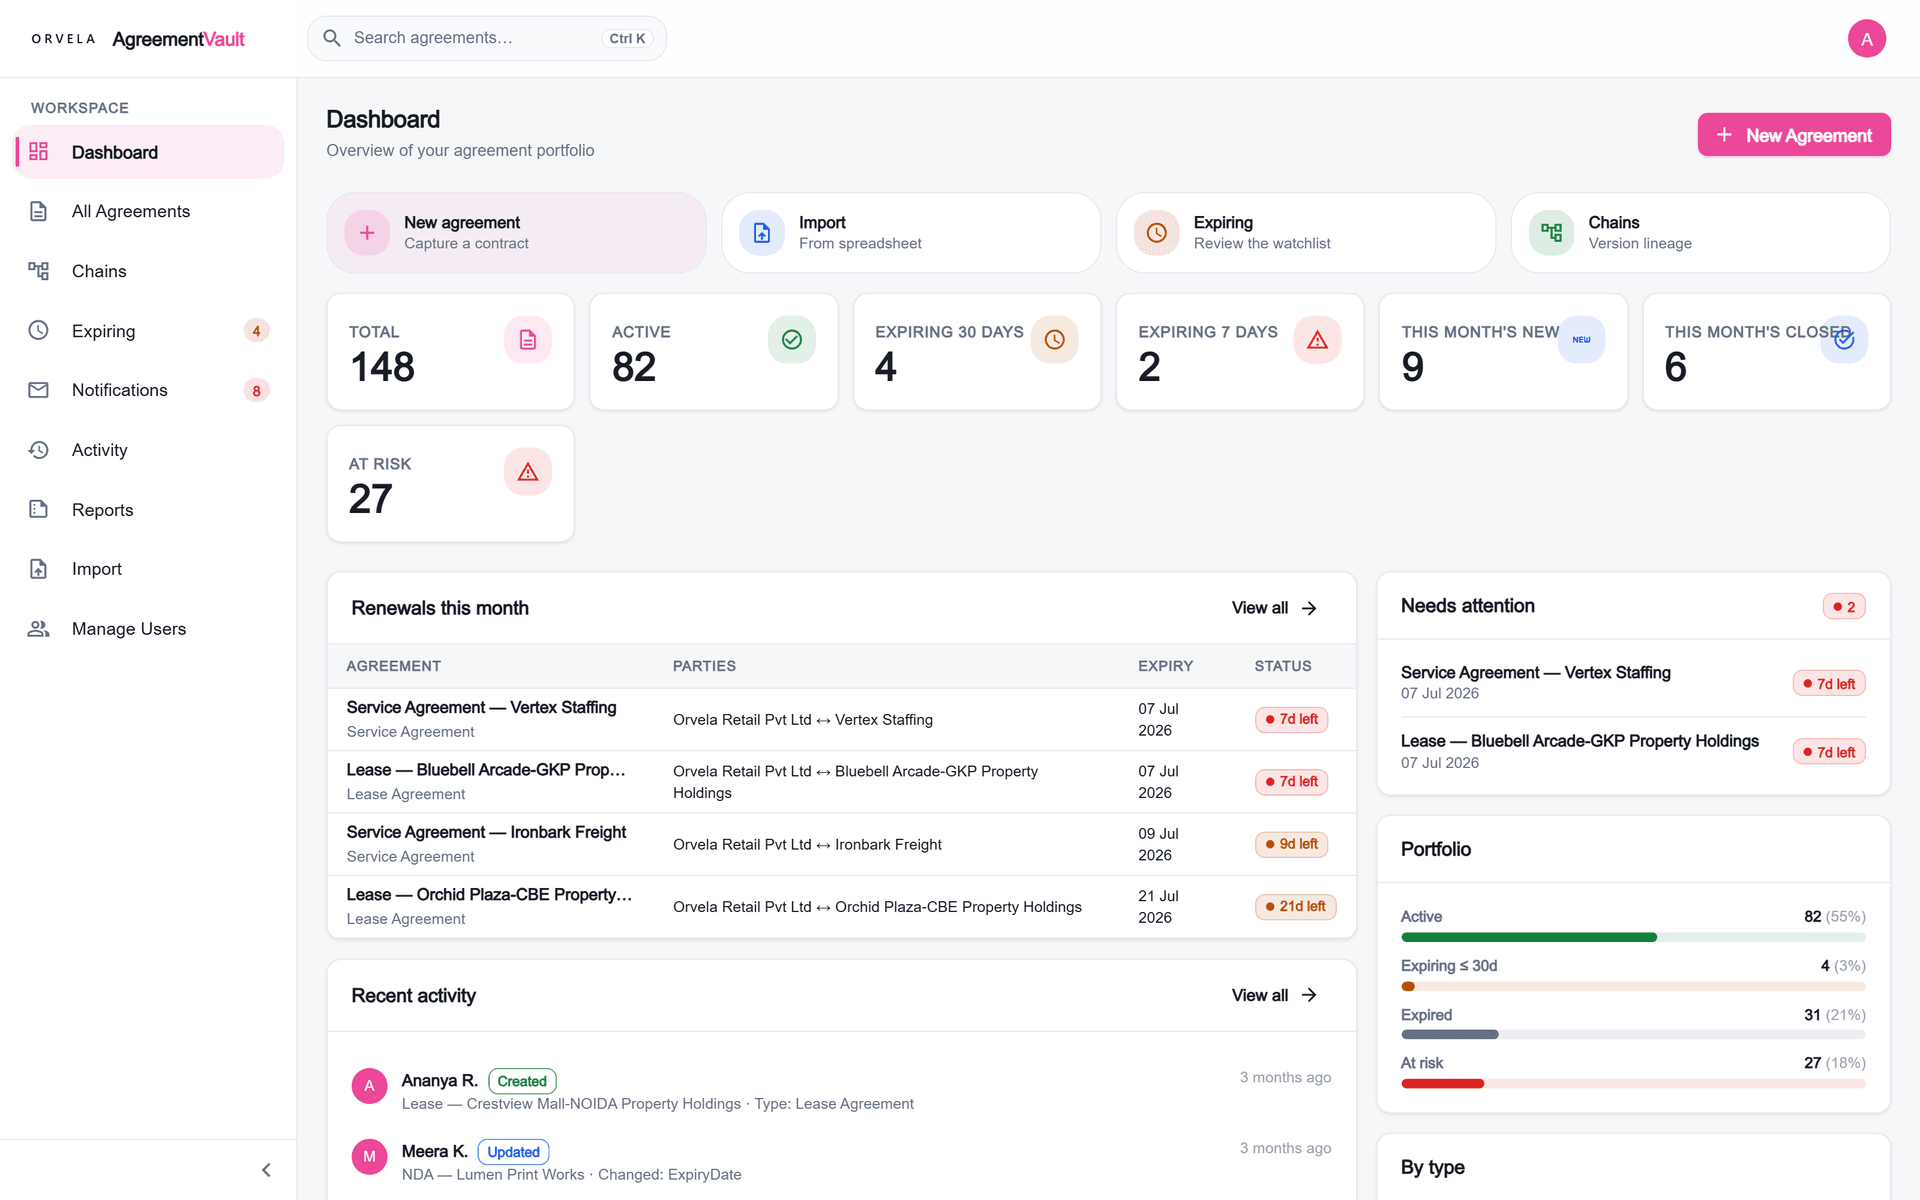
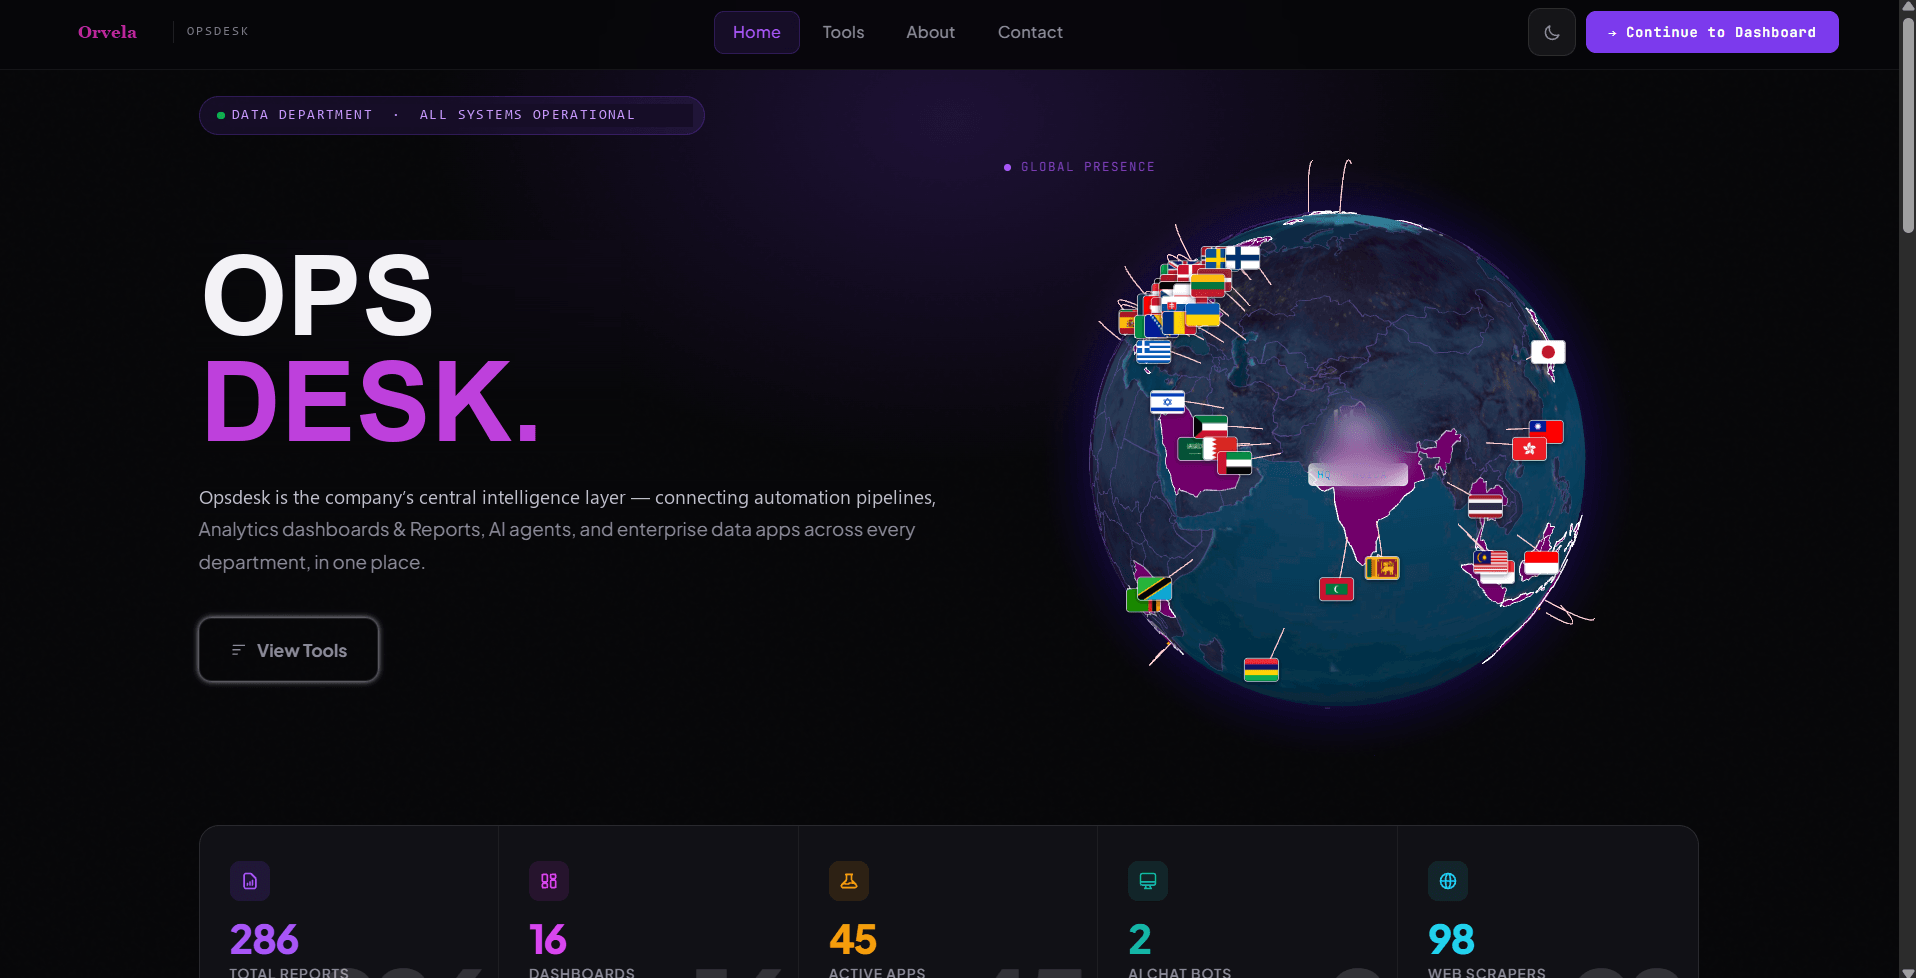
Built over the past year for a national apparel retail group, across finance, stock, sales, HR and legal operations. Eight have full case studies. The screenshots are the real interfaces, with sample figures in place of the client’s.
Also built
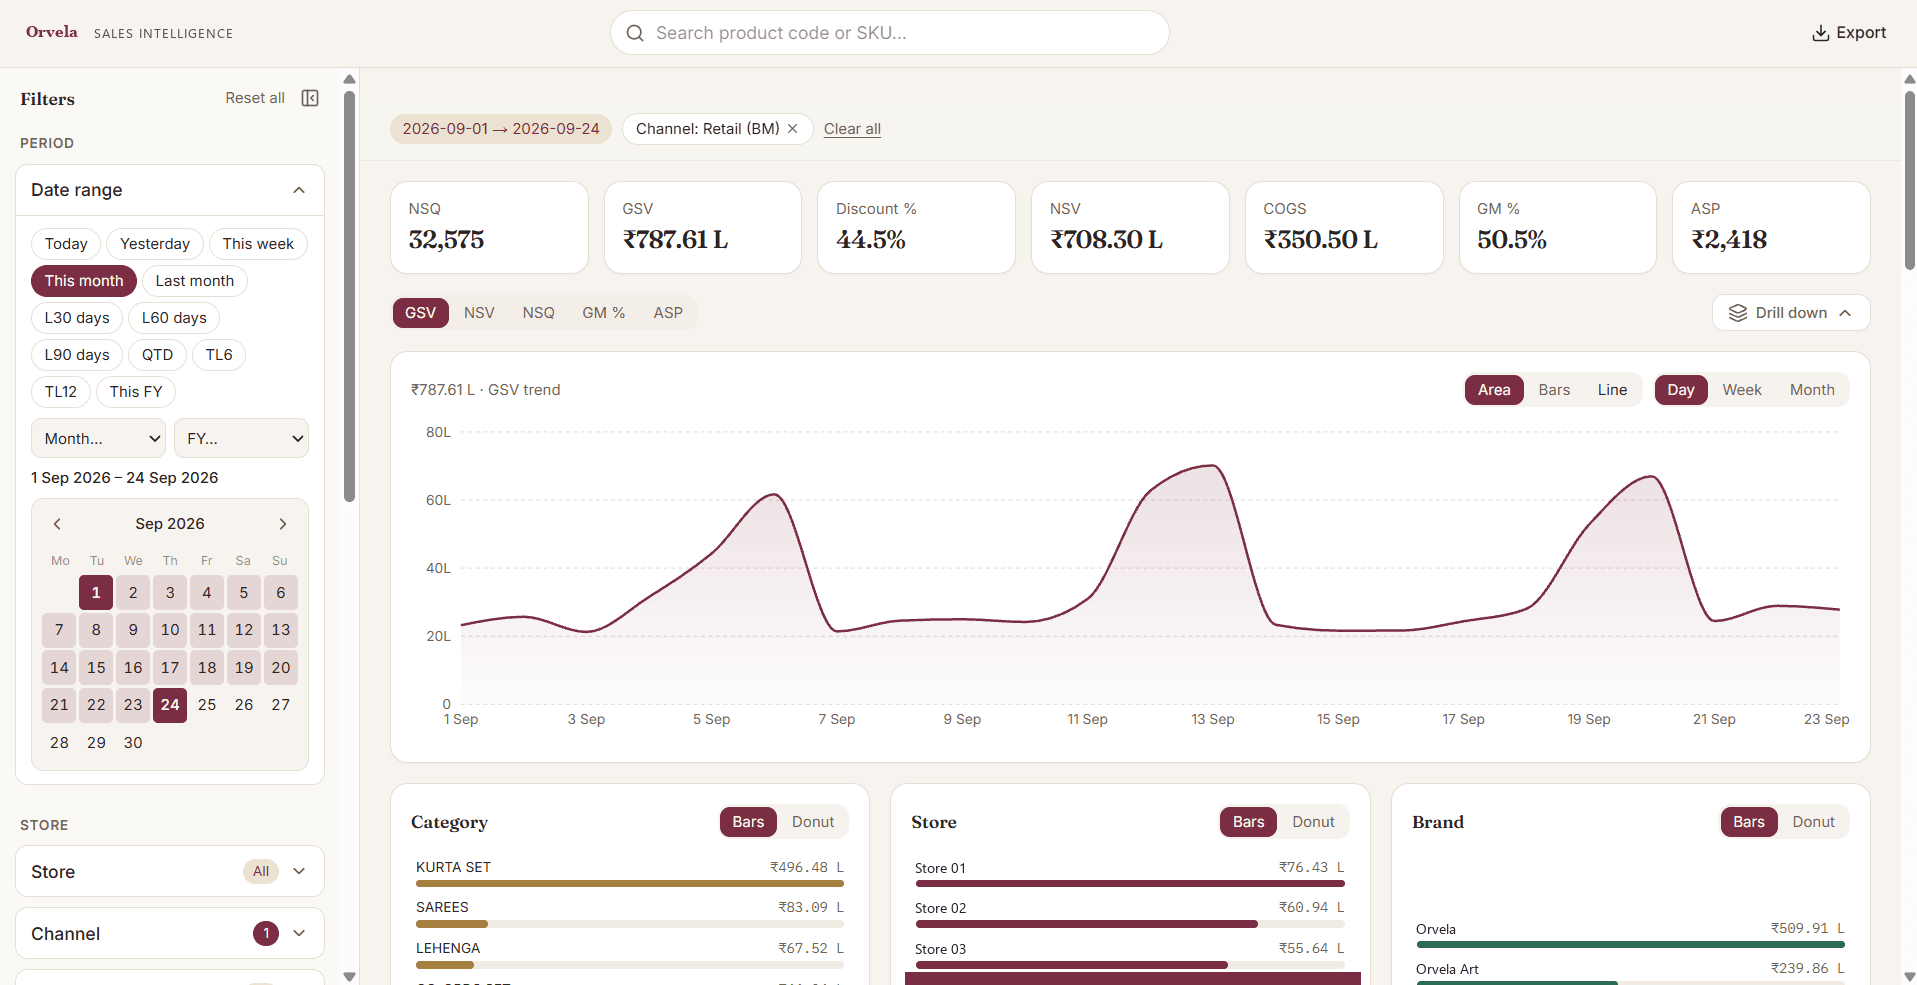
Sales analytics you can hand to fifty store managers without giving away your margins.
1,413,608 sales transactions across 53 stores, 13,081 products and 317 staff, spanning five years. Three access decisions made at the data layer rather than hidden in the interface: a per-user store allowlist enforced row by row, cost visibility gated so gross margin percentage shows while raw cost does not, and customer personal data excluded from every endpoint by design — so it cannot leak through an export, a URL, or a screen somebody adds later.
Payout
Staff incentive engine
Stores computed
38
Staff paid
317
Total payout
₹24.8 L
Avg achievement
96.4%
Payout by store
Tier applied from achievement, then split 85 / 15 front to back of house
| Store | Target | Actual GSV | Achievement | Tier | Team pool | Mgmt pool |
|---|---|---|---|---|---|---|
| OV-Crestview Mall-NOIDA | ₹42.0 L | ₹49.6 L | 118% | 100% | ₹1.20 L | ₹0.21 L |
| OV-Riverside Plaza-DL | ₹42.0 L | ₹43.7 L | 104% | 100% | ₹1.06 L | ₹0.19 L |
| OV-Emerald Walk-BLR | ₹42.0 L | ₹40.3 L | 96% | 75% | ₹0.98 L | ₹0.17 L |
| OV-Highstreet 9-PUNE | ₹42.0 L | ₹38.2 L | 91% | 75% | ₹0.93 L | ₹0.16 L |
| OV-Sunrise Square-LKO | ₹42.0 L | ₹35.3 L | 84% | 50% | ₹0.86 L | — |
| OV-Kingsway Arcade-GGN | ₹42.0 L | ₹30.7 L | 73% | 0% | — | — |
Store incentives calculated the same way every month, for every store.
Achievement against target, four tiered payout bands, a separate management pool, a front-of-house and back-of-house split, and role classification from job titles nobody ever entered consistently. It also carries a store-name normalisation table, because the warehouse, the uploaded target file and the staff list each spell the same store differently — and any incentive tool that ignores that quietly pays the wrong store. What it replaced: a spreadsheet and an argument.
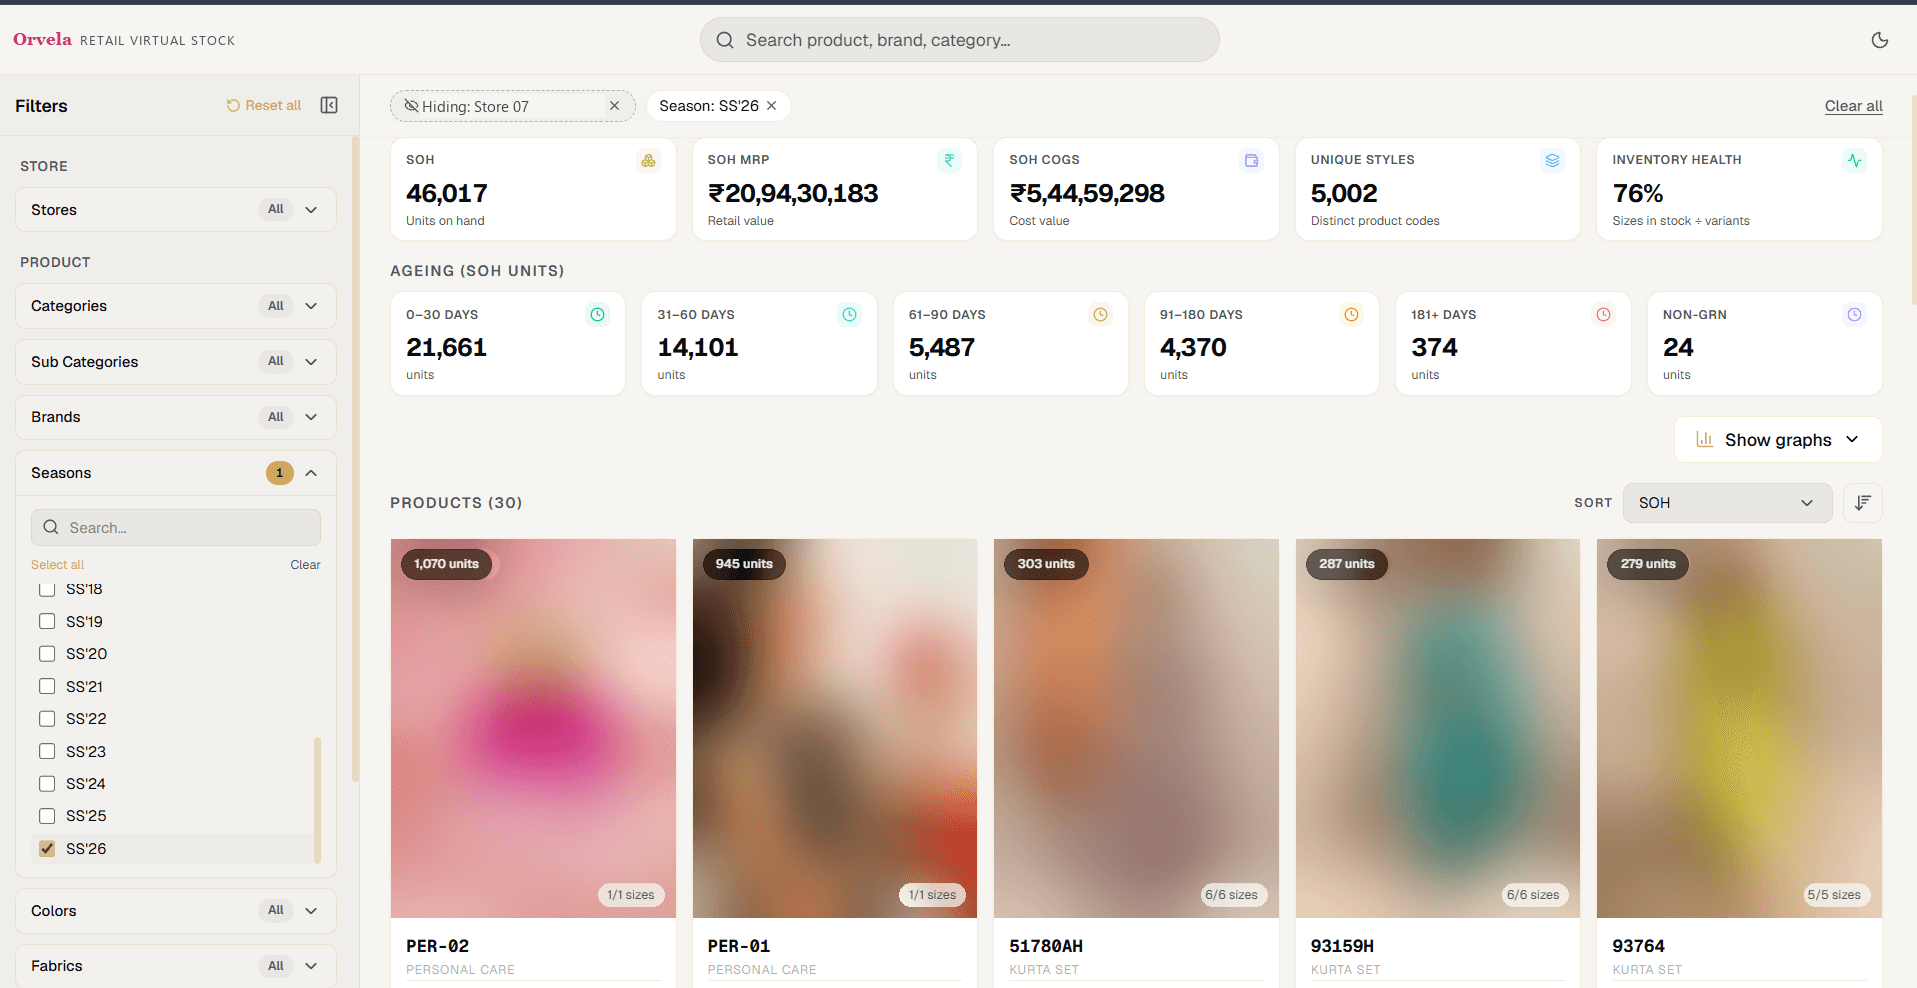
Live stock on hand, with a per-SKU ageing ladder by size and store.
Stock across eight dimensions with an ageing ladder per SKU. The engineering worth noting is the reliability layer: a background job precomputes the heavy overview so the page is instant, with the age of the data shown honestly on screen; a circuit breaker stops a struggling database being hammered by retries; and separate liveness and readiness probes mean the app tells the load balancer the truth about whether it can actually serve.
Proof
Every figure below comes from a system I built and put into production. The screenshots on this site show the real interface running on sample data — the architecture is real, the client’s numbers stay with the client.
₹1.19 crore
Stock variance identified as recoverable in one audit cycle
Stocktake — computed by applying the client’s own written audit policy
99.99%
Barcode match rate across 260,251 reconciliation lines
Stocktake — matched against 334,586 live product codes
2–3 min → 2–5 sec
Report query time, on the same hardware
Daybook — after query and data-model rework
2.35 million
Customer profiles unified across online and in-store
Customer Atlas — 2.7 GB in a single customer-360 table
40%
Reduction in manual HR work
HR automation suite, 2023–25 — documented outcome
153 / 153
Accuracy checks passing on the verified question set
Customer Atlas — six golden-set suites, run before release
Zero
Database queries the AI can write for itself
Customer Atlas — 14 pre-approved data functions; the capability does not exist in the system
12 systems
Built and put into production
Across finance, stock, sales, HR, contracts and customer analytics
Twenty minutes on a call is usually enough for me to tell you whether software is the answer and roughly what it would cost. If it isn’t, I’ll say so.
Available for freelance builds alongside senior engineering work. One or two projects at a time.