“Where is my money leaking?”
Reconciliation and audit systems that find the gap between what you sold, what you shipped and what you were actually paid.
₹1.19 crore of recoverable variance computed across 260,251 reconciliation lines.
Full-stack & AI engineering · Noida, India
I build the internal systems that retail, finance and operations teams run on every day — stock audits, store P&L, reconciliation, analytics — and the AI layer that answers questions about them without inventing numbers.
Available for freelance builds alongside senior engineering work. One or two projects at a time.
Systems now running in
Proof
Every figure below comes from a system I built and put into production. The screenshots on this site show the real interface running on sample data — the architecture is real, the client’s numbers stay with the client.
₹1.19 crore
Stock variance identified as recoverable in one audit cycle
Stocktake — computed by applying the client’s own written audit policy
99.99%
Barcode match rate across 260,251 reconciliation lines
Stocktake — matched against 334,586 live product codes
2–3 min → 2–5 sec
Report query time, on the same hardware
Daybook — after query and data-model rework
2.35 million
Customer profiles unified across online and in-store
Customer Atlas — 2.7 GB in a single customer-360 table
40%
Reduction in manual HR work
HR automation suite, 2023–25 — documented outcome
153 / 153
Accuracy checks passing on the verified question set
Customer Atlas — six golden-set suites, run before release
Zero
Database queries the AI can write for itself
Customer Atlas — 14 pre-approved data functions; the capability does not exist in the system
12 systems
Built and put into production
Across finance, stock, sales, HR, contracts and customer analytics
Reconciliation and audit systems that find the gap between what you sold, what you shipped and what you were actually paid.
₹1.19 crore of recoverable variance computed across 260,251 reconciliation lines.
Analytics over millions of rows that a regional manager can read on a phone, in seconds, seeing only the stores they are allowed to see.
A report that took two to three minutes now returns in two to five seconds.
AI that answers business questions in plain language, built so it cannot state a number it did not get from your data.
Four layers of grounding; 153 of 153 verified questions passing before release.
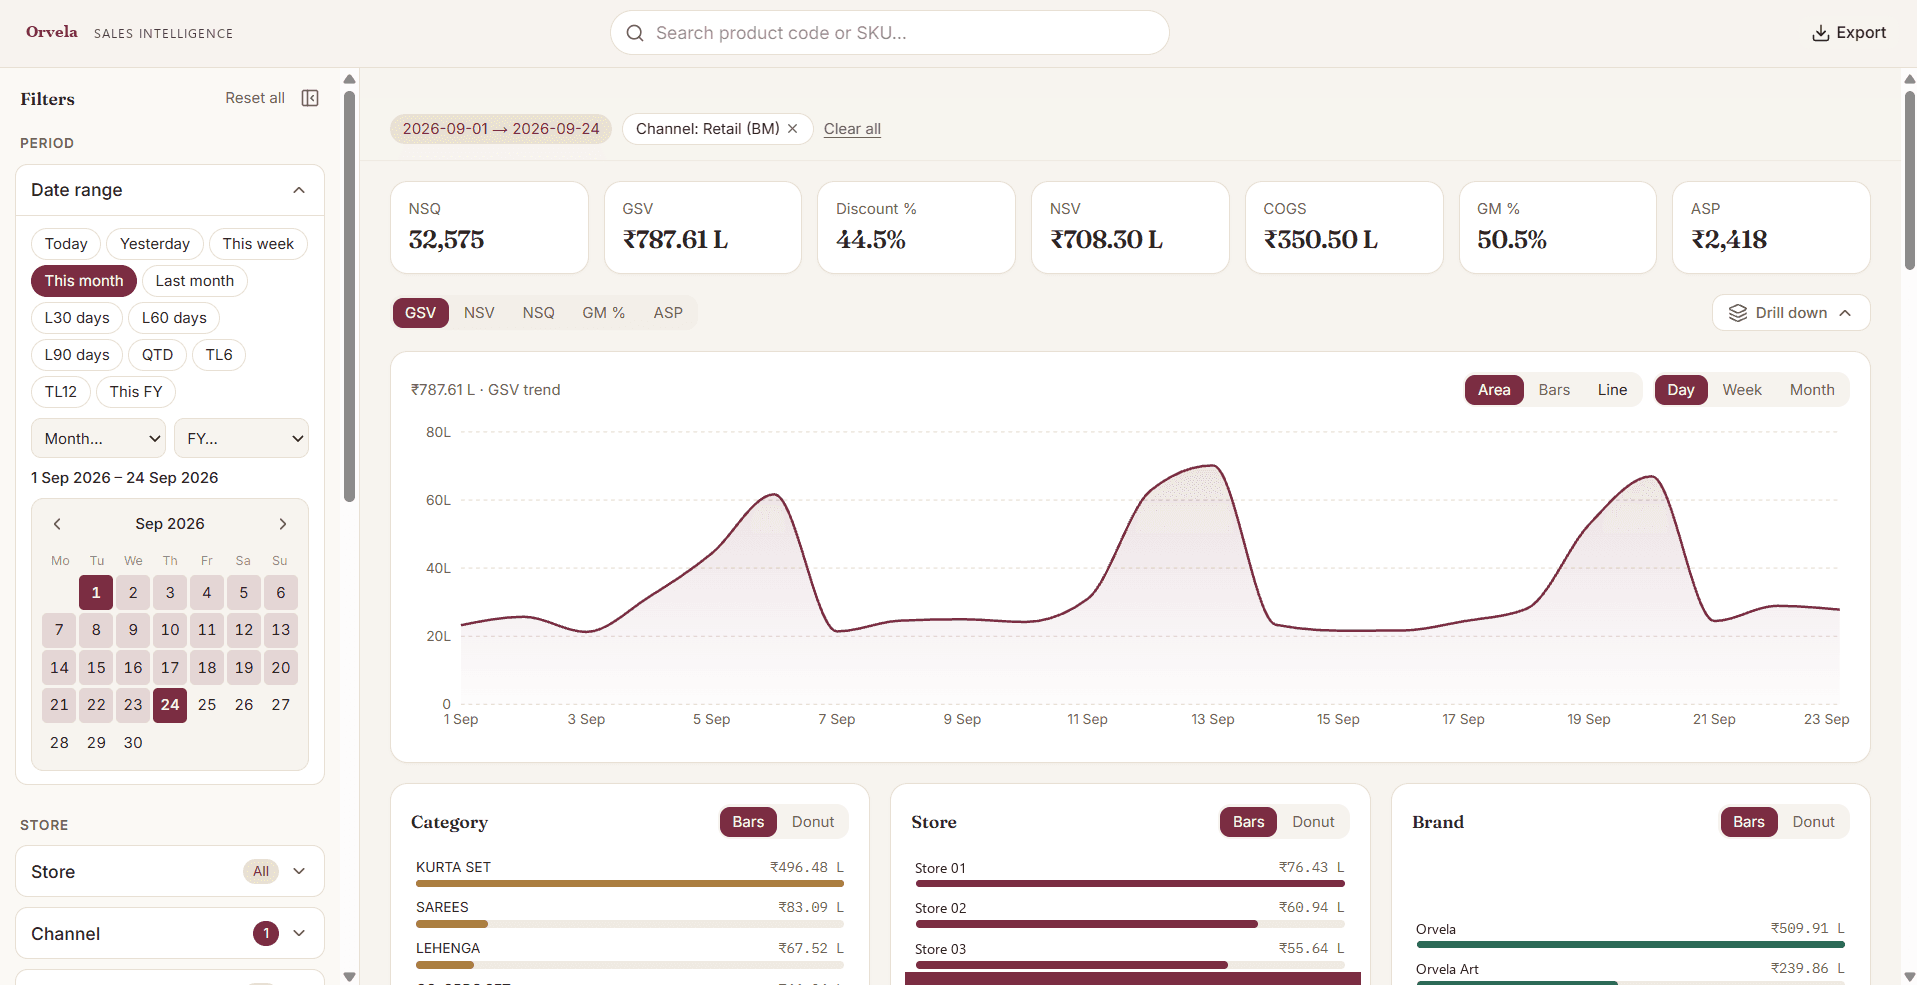
Salesgrid · sales analytics
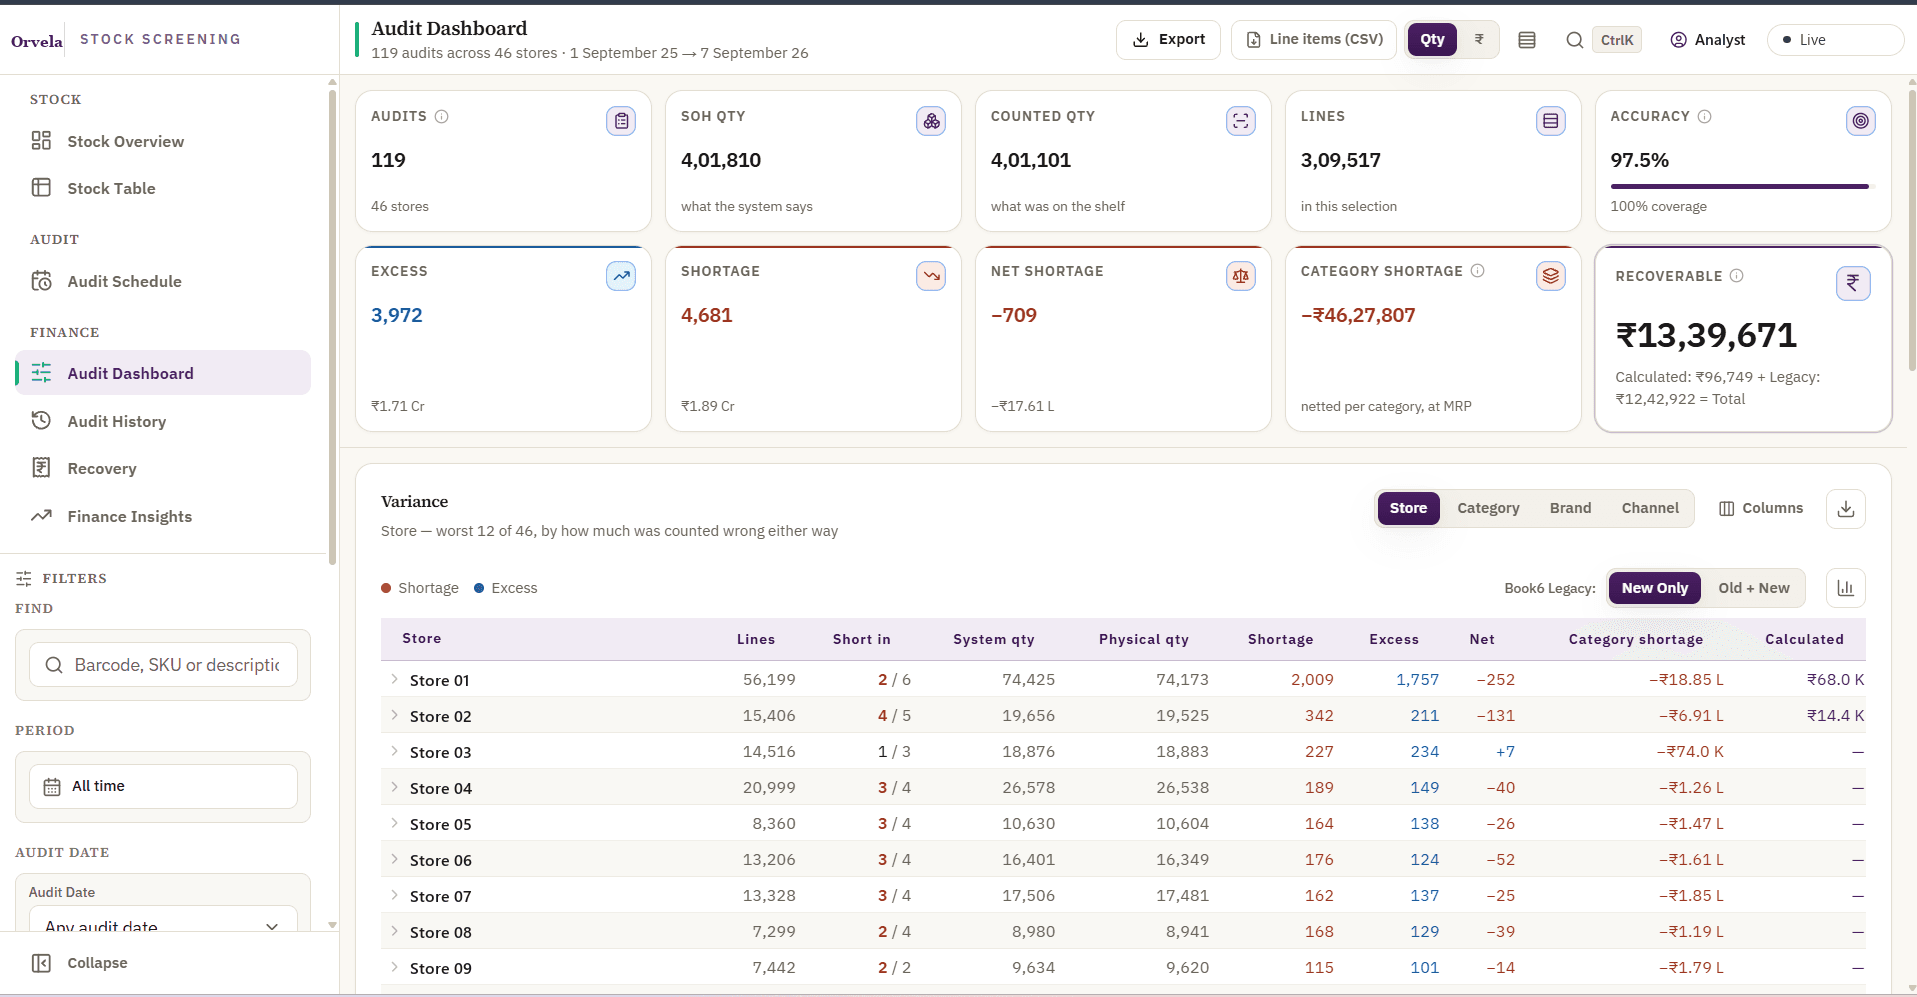
Stocktake · stock audits
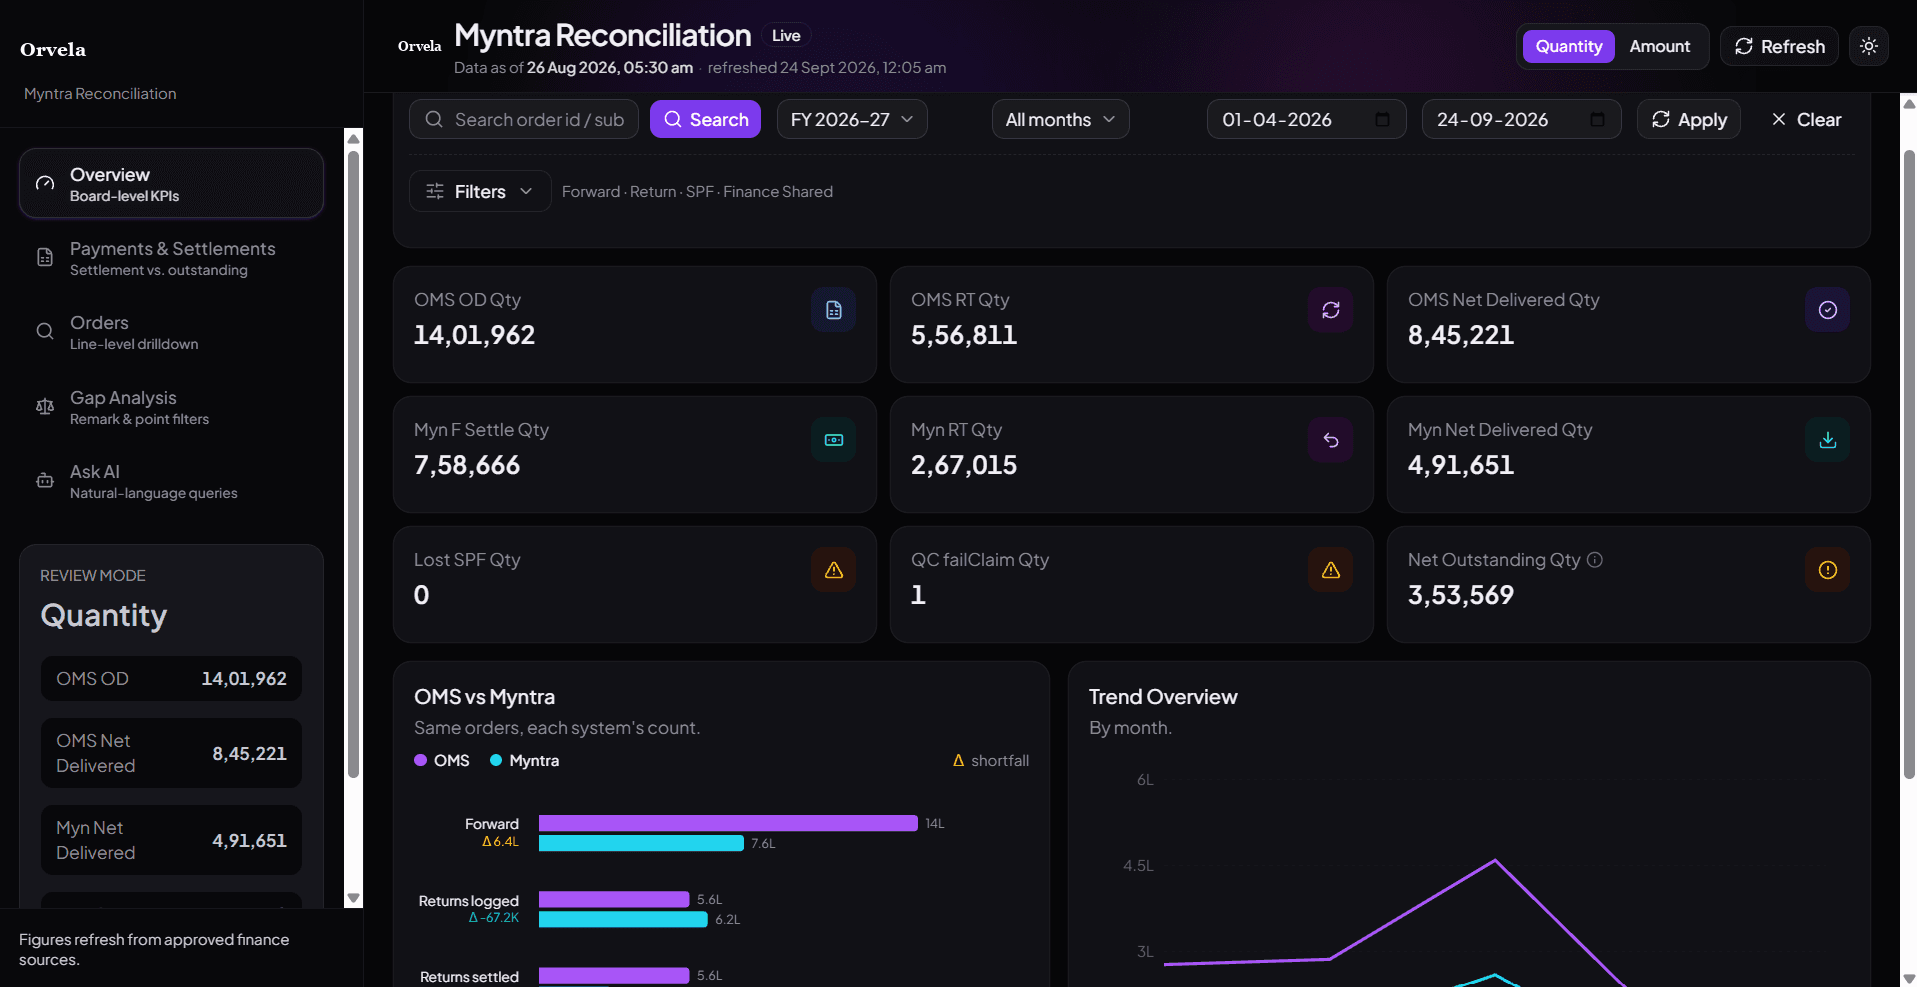
Settle · marketplace finance
Stock audits, marketplace settlements and sales analytics — three of the twelve, each replacing something that was failing.
Selected work
Each one replaced something that was failing: a broken tool, a report nobody opened, and a question no dashboard could answer.
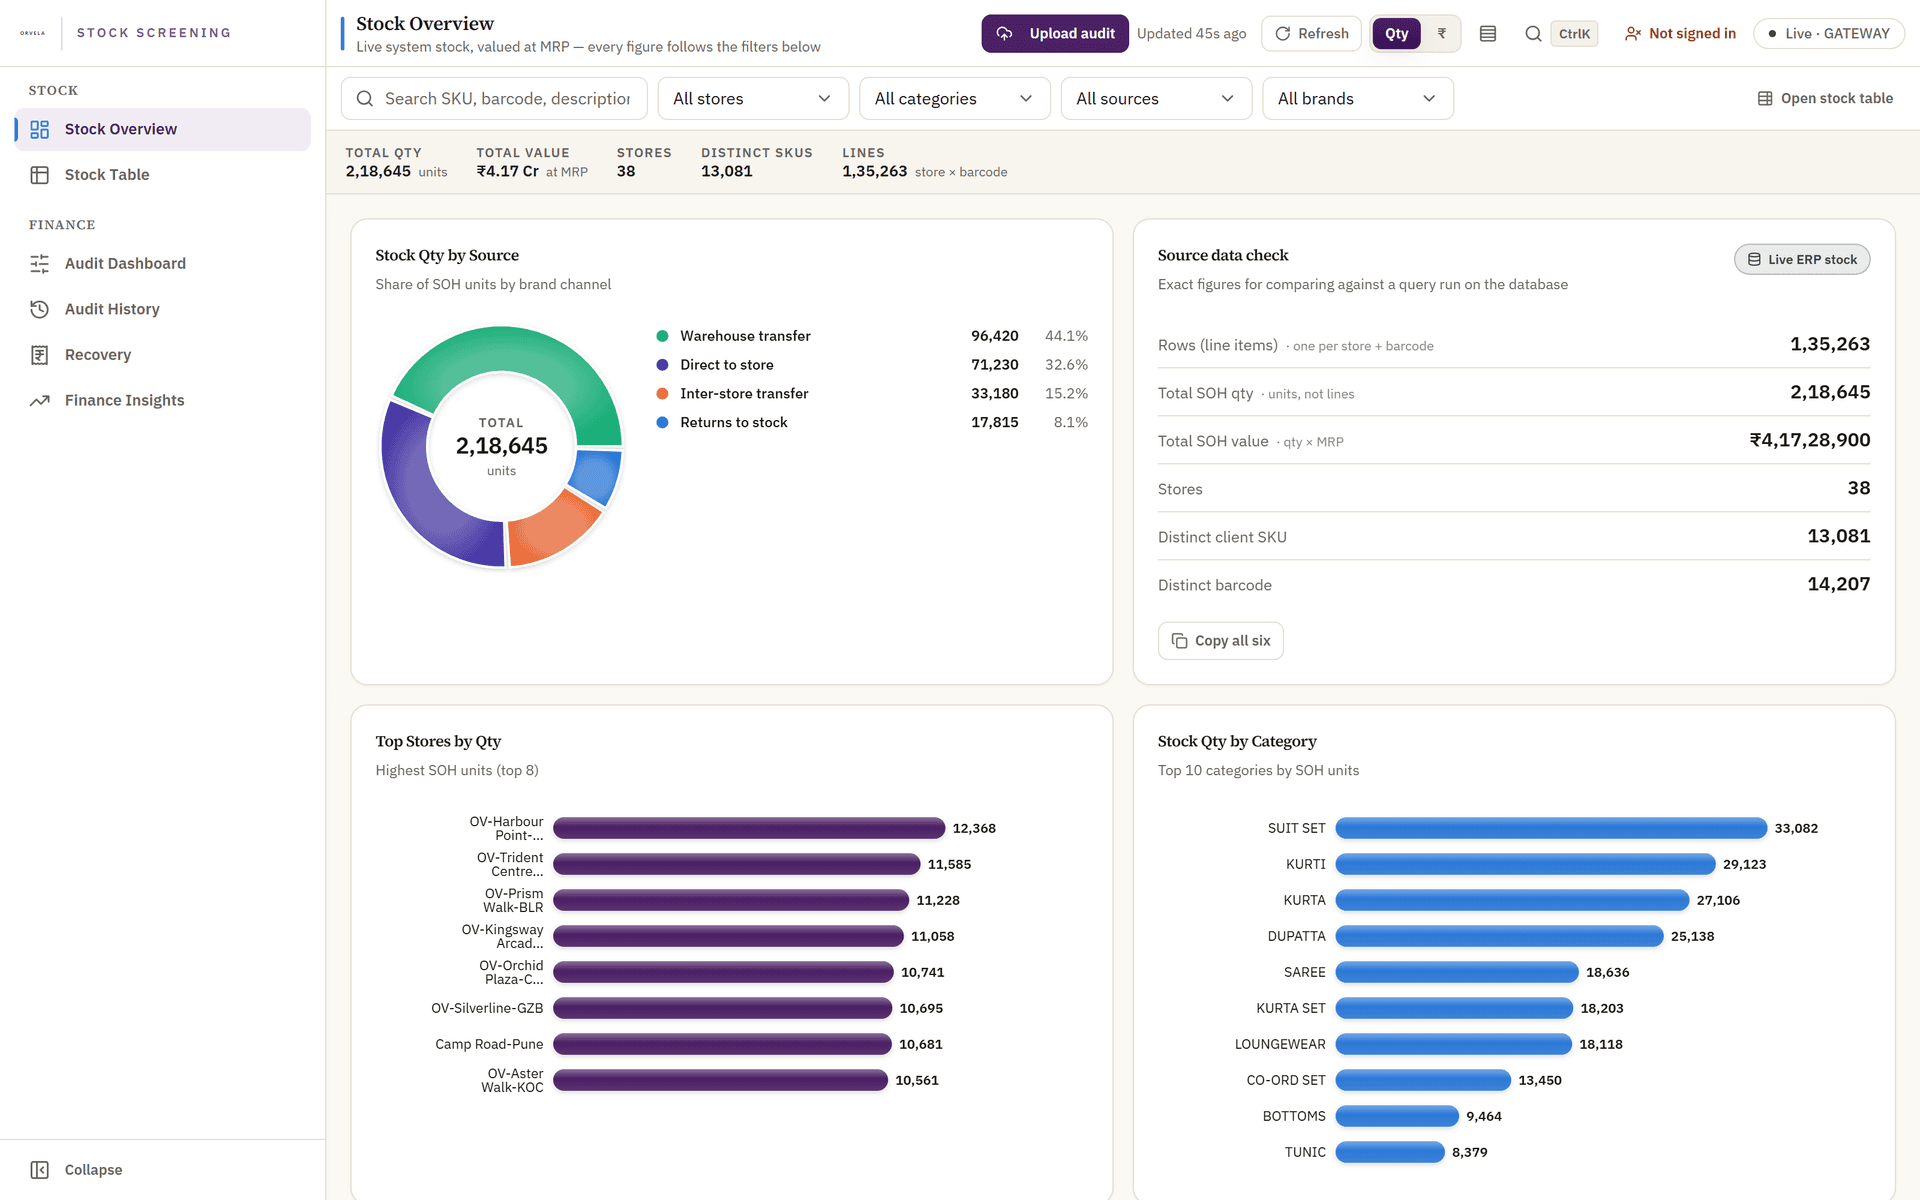
Swipe to see the full screen
01/Retail operations · 50+ stores
A stock audit tool that was reporting 450 units where there were 218,645
Customer Atlas
Unified customer intelligence
Which cities grew repeat revenue fastest this quarter?
Repeat revenue grew fastest in Bengaluru, up 22.4% to ₹4.82 Cr from 18,402 repeat customers. Pune follows at +18.7%. Hyderabad is the only city in the top six to contract, down 3.2%, driven by a fall in second-purchase rate rather than acquisition.
Evidence — rows returned
| City | Repeat customers | Repeat revenue | vs prior |
|---|---|---|---|
| Bengaluru | 18,402 | ₹4.82 Cr | +22.4% |
| Delhi | 16,918 | ₹4.31 Cr | +9.1% |
| Pune | 11,244 | ₹2.96 Cr | +18.7% |
| Hyderabad | 9,870 | ₹2.44 Cr | −3.2% |
| Lucknow | 7,455 | ₹1.71 Cr | +14.9% |
| Kochi | 6,102 | ₹1.38 Cr | +6.6% |
How this answer was built
Understand
Matched a verified question
Scope
All stores — no restriction
Fetch
4 of 14 approved tools
Ground
7 of 7 figures traced
Leak check
Passed
Model-written database queries: 0. The capability does not exist in this system.
Swipe to see the full screen
02/Retail · online storefront + 50 stores
One customer view across online and in-store — with an AI analyst that cannot invent a number
Swipe to see the full screen
03/Retail finance · 51 stores
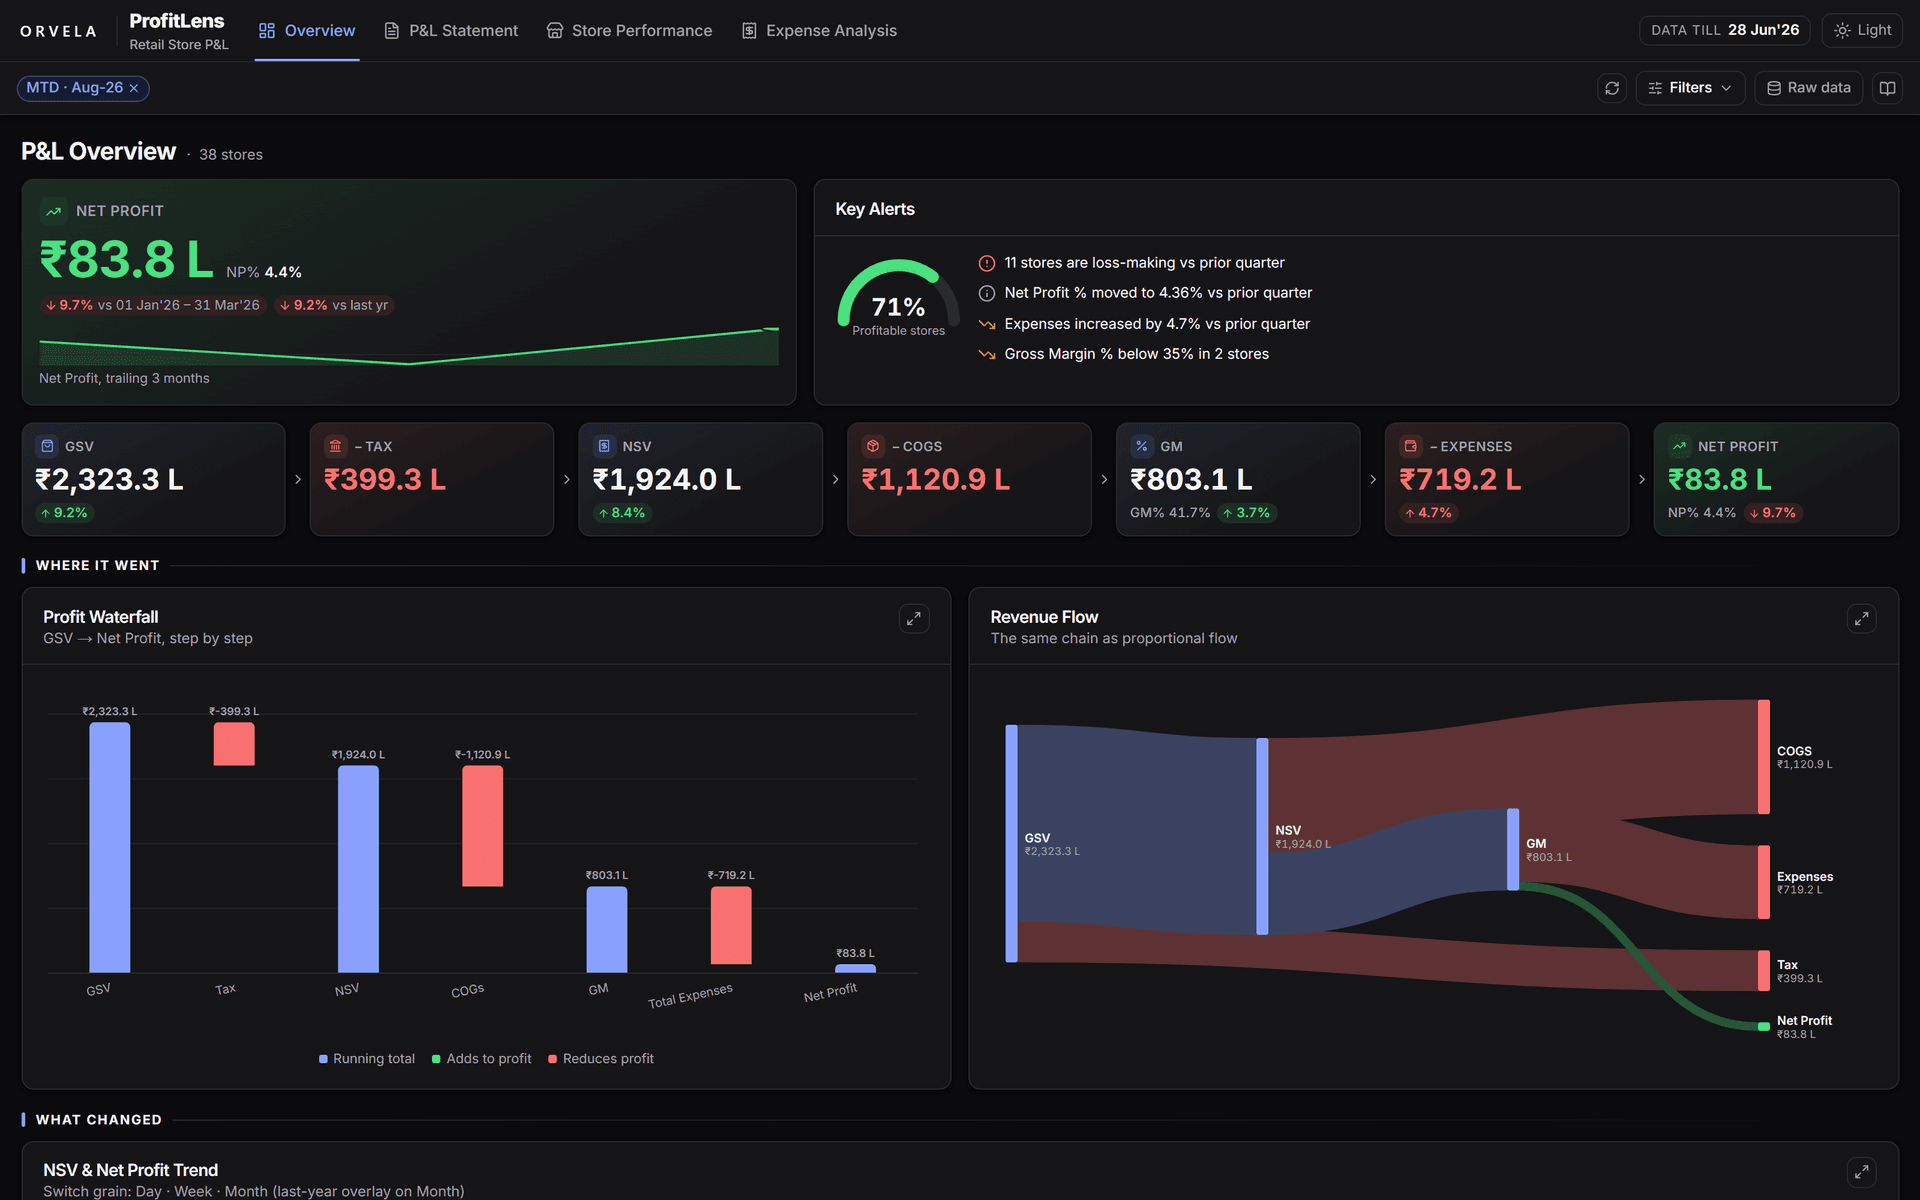
Store P&L stopped being a monthly file that nobody opened
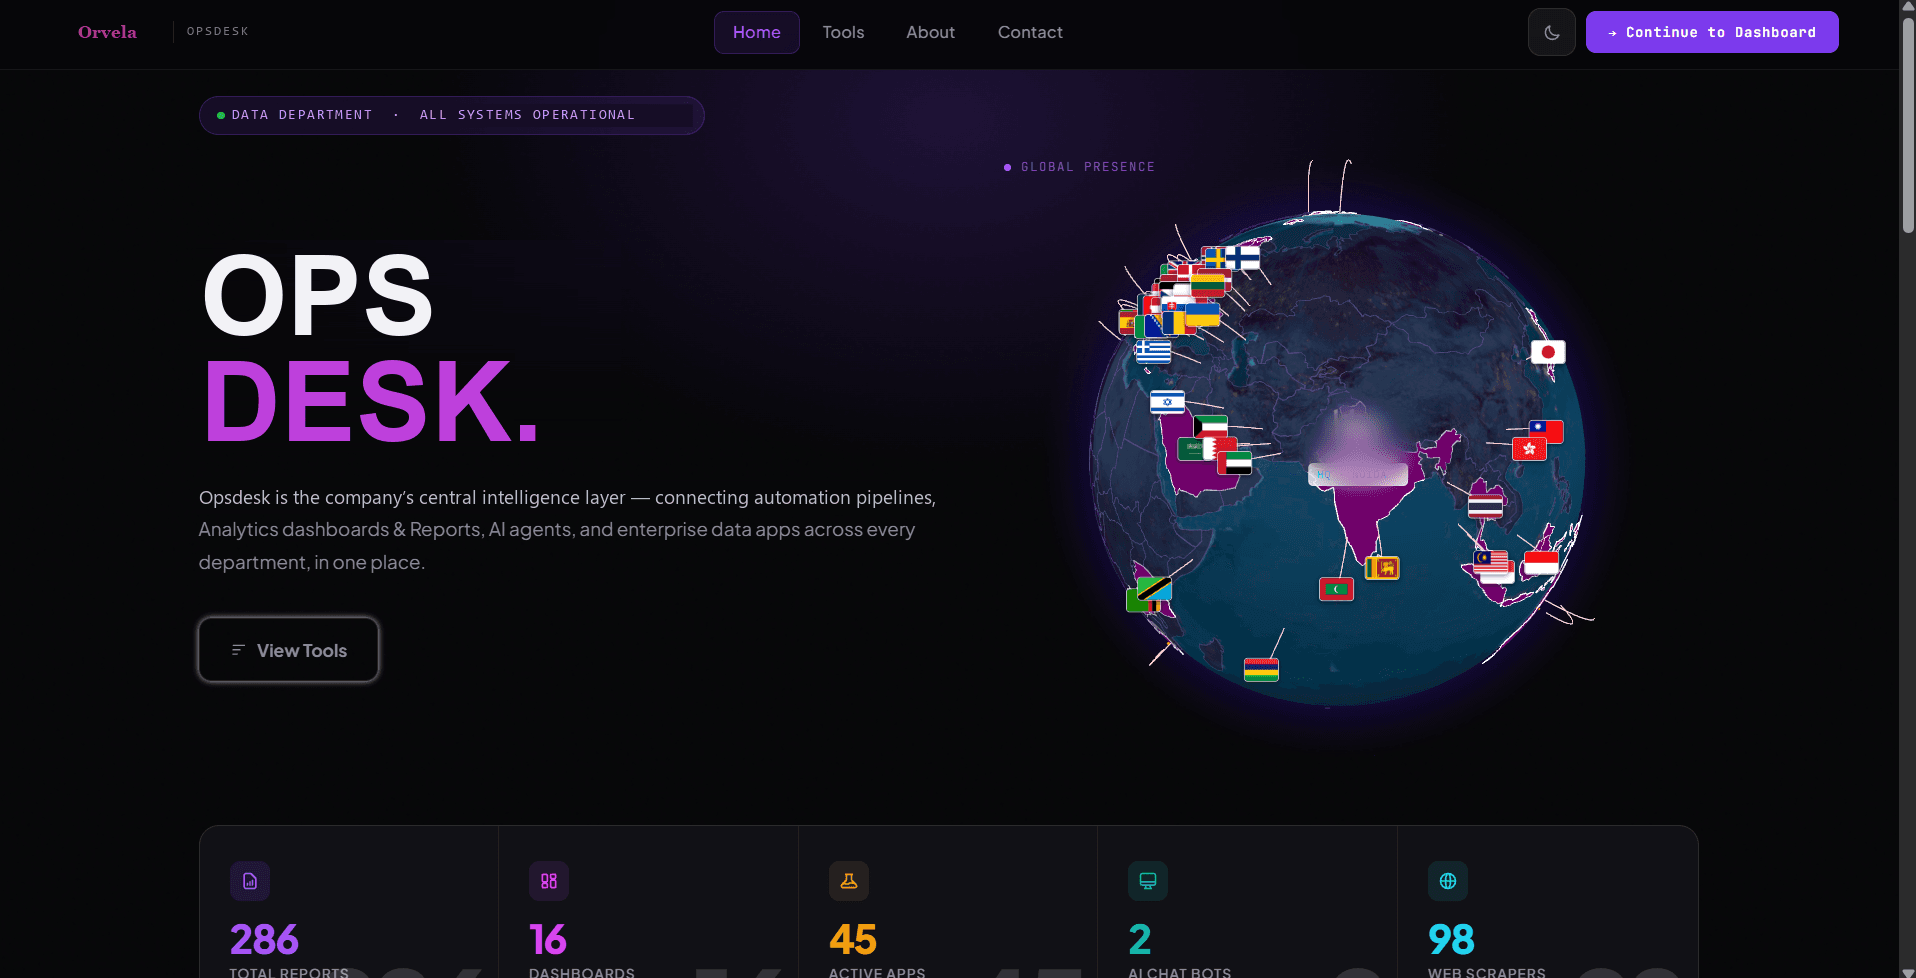
01/Marketplace & warehouse operations
Around ninety screens replacing spreadsheets and email threads — with permissions deciding who sees which.
See how it works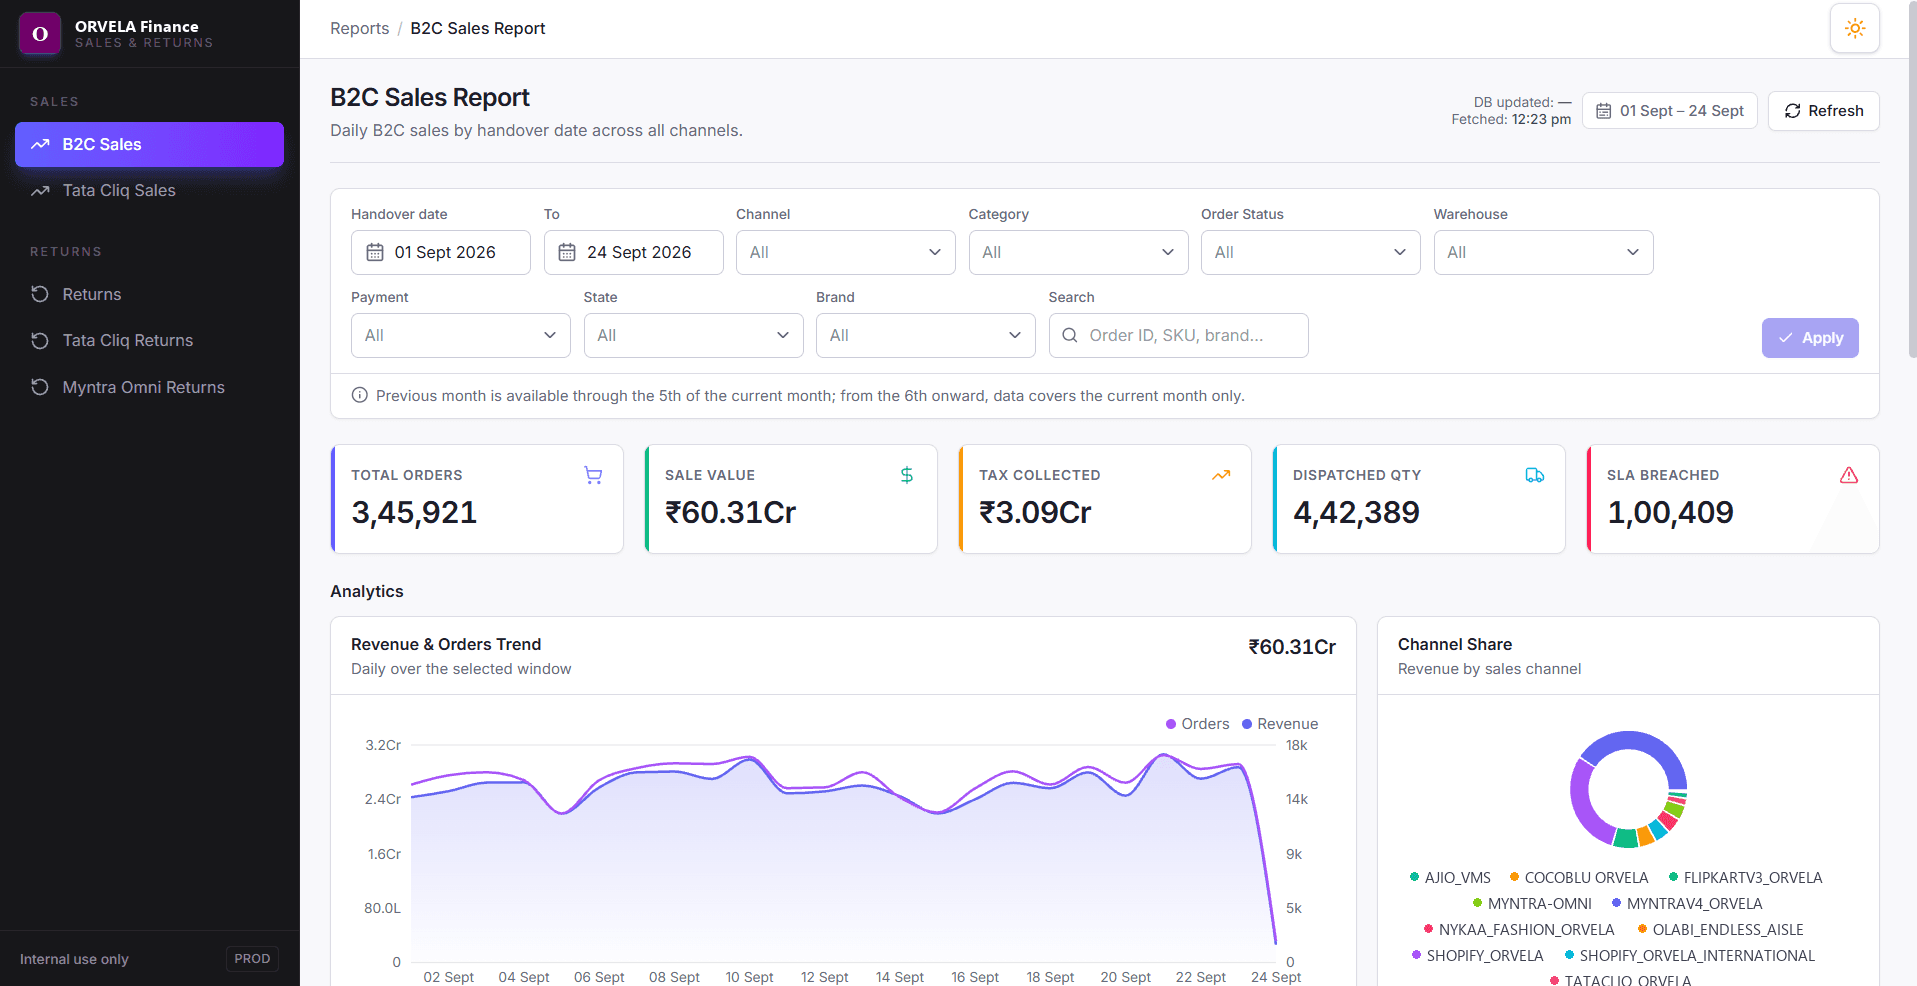
02/Finance operations
Daily sales and returns across every marketplace, rebuilt so the report is ready before the coffee is.
See how it works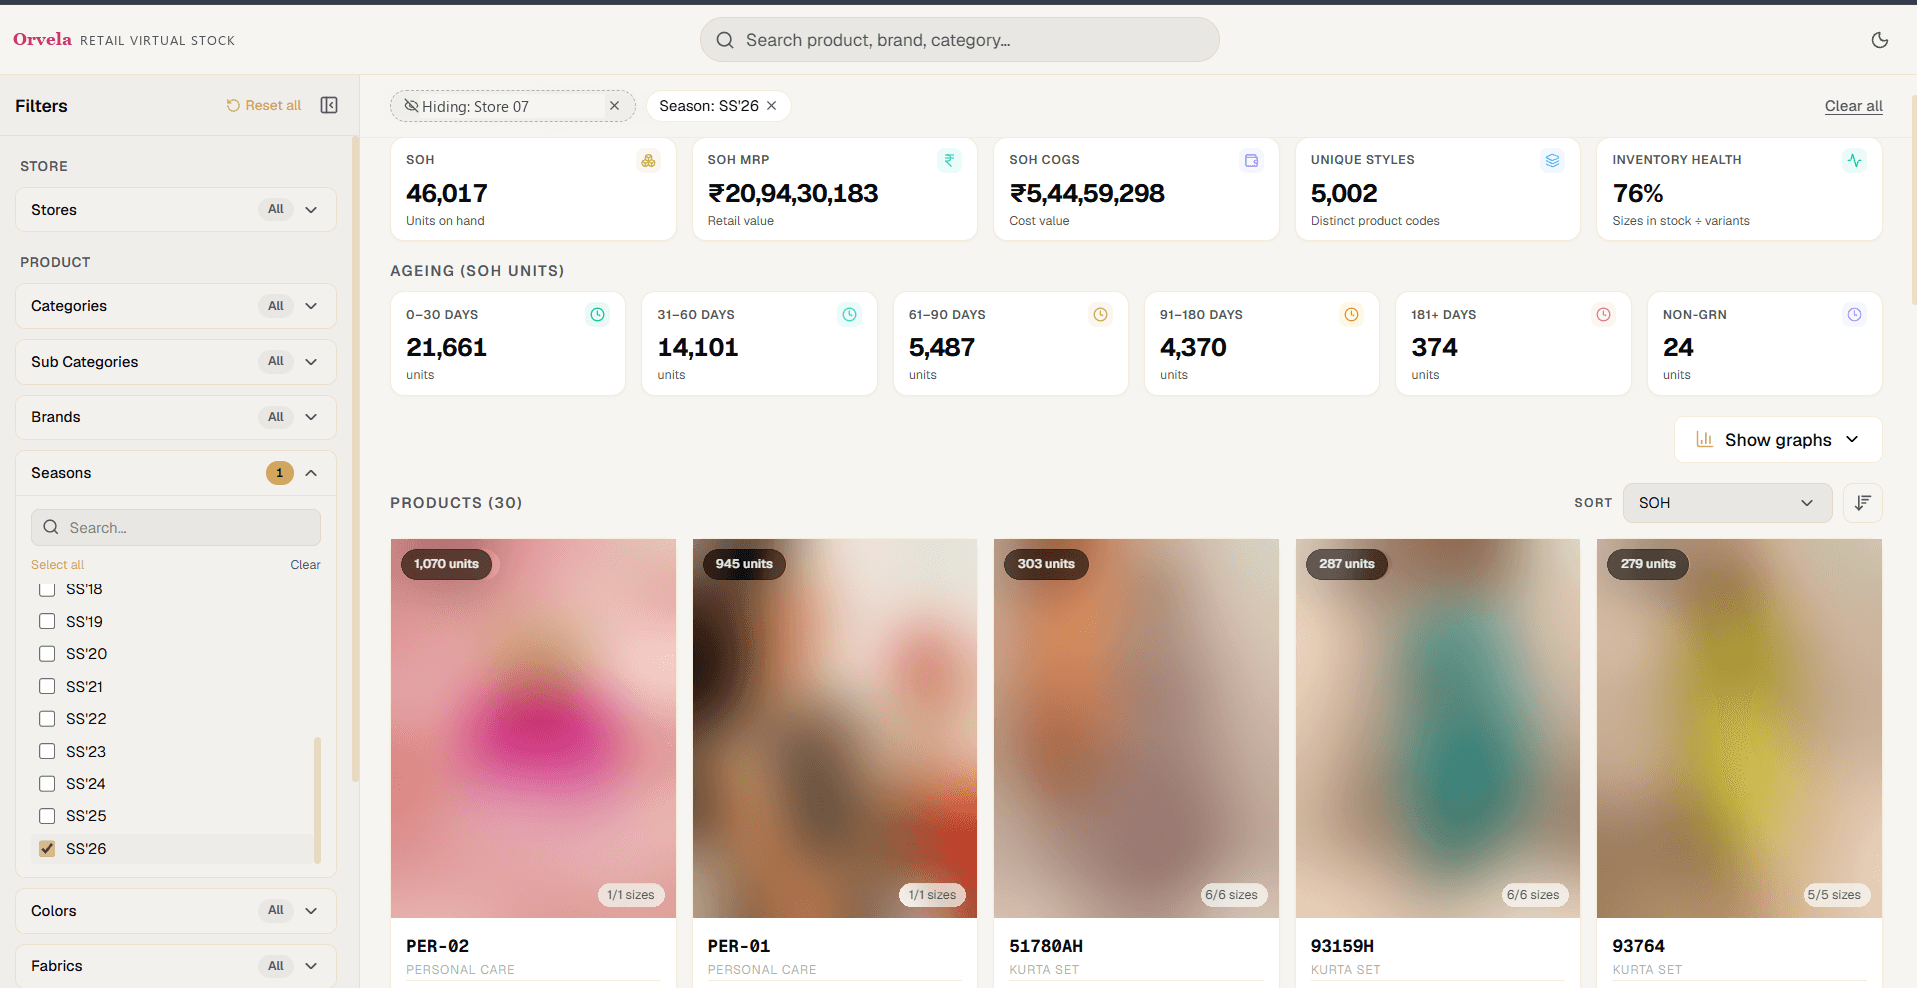
03/Retail stock
Live stock on hand with an ageing ladder per product, precomputed so the page is instant.
See how it works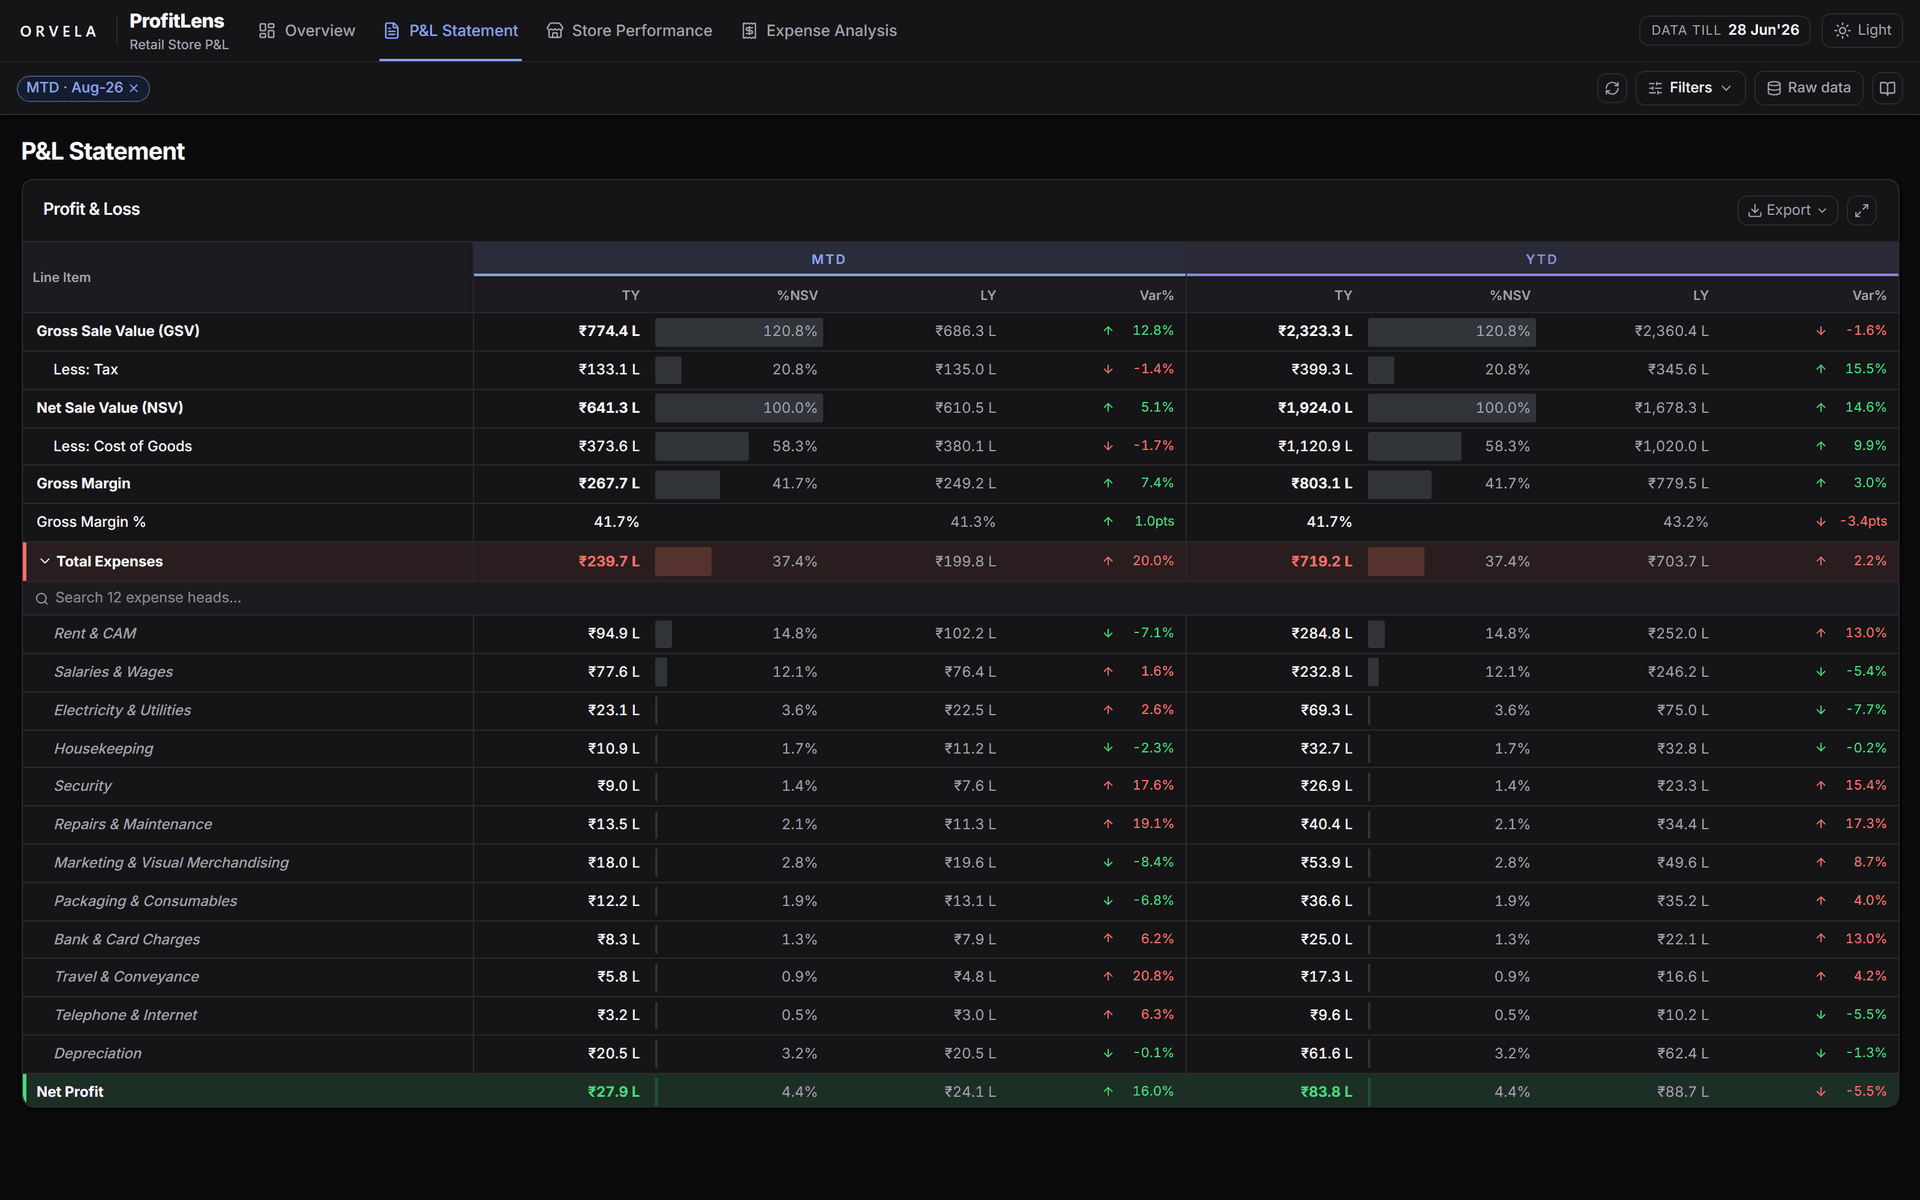
04/Retail finance · 51 stores
Seven bars from gross sales to net profit, per store, live — you can see which one is eating the month.
See how it worksAI built into the work
The AI sits on top of the same data your dashboards use, so the answer to a question is the answer your finance team would have given — just in seconds instead of days.
Type “which stores lost the most stock this quarter?” and get the figure, the ranked list and a short explanation back in seconds — no report request, no waiting for an export.
Each answer arrives with the rows it was built from, so anyone in the room can see where a figure came from and check it in one click.
One finance assistant runs on self-hosted models, so your questions and your data stay inside your own systems.
Services
Six things I have shipped more than once, so I can scope them honestly.
Your team asks questions in plain English and gets an answer with the figures and the table behind it — built so the AI cannot state a number that is not in your data.
Evidence Customer Atlas — 2.35M unified customer profiles, 153 of 153 accuracy checks passing. Finance Copilot — self-hosted models with a read-only query guard.
Not a BI licence and a template. A purpose-built application that computes your metrics your way, with the access rules your business actually needs.
Evidence ProfitLens — 51-store P&L with a gross-sales-to-net-profit waterfall, which replaced a Power BI report. Salesgrid — 1.4 million transactions with per-user store access and no customer personal data in any output.
Where two systems should agree and do not — physical stock against book stock, orders against marketplace settlements, claims against payouts. I build the thing that finds the gap and produces a number you can defend in a meeting.
Evidence Stocktake — 260,251 reconciliation lines at a 99.99% match rate, producing ₹1.19 crore identified as recoverable. Settle — orders reconciled against forward settlements, return settlements and lost claims.
The processes currently living in a spreadsheet and an email thread: contracts and renewals, purchase orders, referrals, requests moving through stages with approvals.
Evidence Agreement Vault — contract and lease lifecycle with renewal chains, rent-escalation schedules and scheduled reminders. Shortlist — a referral pipeline with automated résumé screening.
If your reports time out, your exports crash the browser, or a page takes three minutes, that is usually fixable without replacing anything.
Evidence Daybook — reports taken from 2–3 minutes to 2–5 seconds on the same hardware, across a join fanning 2.4 million rows to 8.5 million against a 19-million-row table.
Getting data out of the places it is stuck: marketplace portals, an ERP, a warehouse system, a mailbox full of settlement reports, a folder of spreadsheets that all name their columns differently.
Evidence Opsdesk — around 90 screens across seven marketplace and logistics integrations, plus a scheduled job that pulls settlement reports out of a mailbox. Stocktake and Payout — spreadsheet imports that find the real header row and repair Excel date serials.
Twenty minutes. You describe what is slow, manual or unreliable. I tell you honestly whether software is the answer.
Agreed before I start. I do not begin on an estimate.
Something real and usable early, then the rest.
Code, database, documentation, deployment. On your servers, on standard technology. Nothing you rent from me.
The things people ask me on the first call.
Because every system here runs on a company’s live sales, stock and financial data, and I don’t put client data or client code on the public internet.
The screenshots are the genuine interfaces with sample figures substituted. On a call I’ll screen-share and walk through whichever system is closest to your problem, and answer any question about how it works. That’s the same discretion your data would get.
Yes, and here’s how I keep that true. I take one or two outside projects at a time, never more.
Before we start you get a scope, a milestone schedule, and what each milestone delivers — working software you can open, not a status update. If a week slips you hear it from me that week, not at the deadline. If your timeline needs full-time attention, I’ll tell you at the first conversation instead of taking the work and disappointing you.
Agreed, and that’s where most of the effort goes.
The systems I build don’t let the model produce a figure on its own. The data is fetched first by fixed, pre-approved queries. The model writes the sentence around it. Then every number in that sentence is extracted and checked against the data that was actually fetched — and if a figure appears that wasn’t in the results, the whole answer is thrown away and replaced by one built directly from the data.
In the newer system the model has no ability to write a database query at all, so there is nothing to go wrong in that direction. There’s a documented accuracy suite that has to pass before anything ships.
Then it doesn’t. One of the reconciliation systems here runs its entire AI layer on self-hosted models on the company’s own hardware — the questions, the data and the answers never touch an external service. That’s a real production deployment, not a plan.
If your situation allows a hosted model I’ll use one, because it’s cheaper and better. If it doesn’t, this is a solved problem.
Often you shouldn’t, and I’ll say so.
Build when the tool can’t express your business rules — a category-netted shortage calculation, a tiered incentive matrix, a recovery threshold cross-referenced against sales — or when the people who need the answer won’t open a BI tool.
One of the systems here replaced a Power BI report for exactly that reason: the numbers were right, but nobody looked at them, and the report couldn’t show a store manager their margin without also showing them the cost price. A purpose-built app could.
About
I build software for the unglamorous parts of a business — the stock count, the settlement file, the renewal nobody remembered, the incentive sheet that took three days and still caused an argument.
I’m a full-stack and AI engineer working for a national apparel retail group, where I’ve shipped twelve internal systems across finance, stock, sales, HR and contracts. I take on a small number of projects outside that work — small enough that each one gets real attention.
Twenty minutes on a call is usually enough for me to tell you whether software is the answer and roughly what it would cost. If it isn’t, I’ll say so.
Available for freelance builds alongside senior engineering work. One or two projects at a time.