Retail finance · 51 stores

Store P&L stopped being a monthly file that nobody opened

Store profitability existed, in a Power BI report, and it was correct. Almost nobody opened it. I replaced it with a purpose-built application that a regional head opens on a phone and a store manager is actually allowed to see.

51 stores

with live P&L, profitable versus loss-making on the front page

7 steps

from gross sales to net profit in one waterfall

Under 35%

gross margin flagged automatically, per store

1 report

Power BI report retired

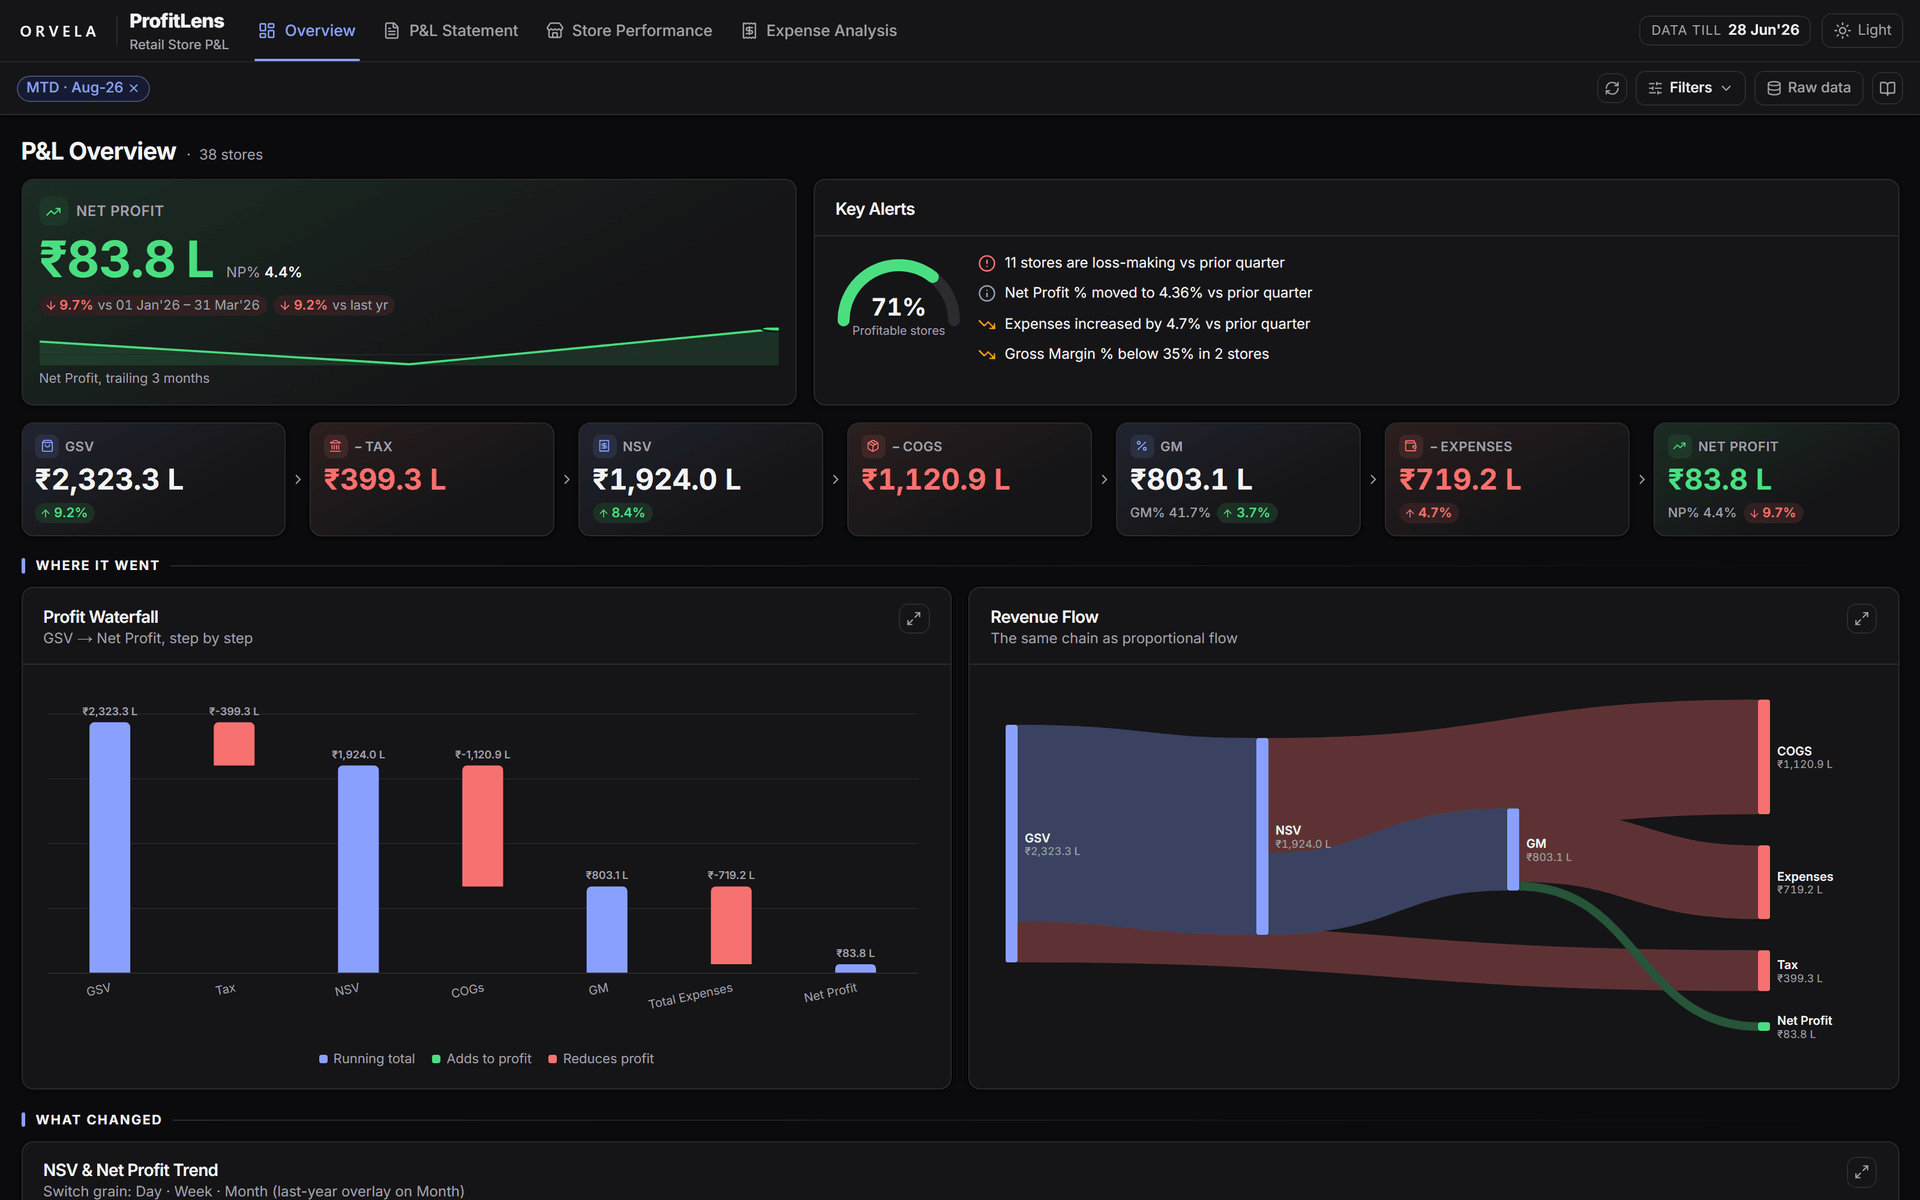
Executive summary with six KPI tiles, a net-sales versus net-profit trend, a profit waterfall and an automated alerts panel.

Swipe to see the full screen

The whole chain’s position in one screen — and the alerts panel telling you which stores are losing money before anyone asks.

The situation

The numbers were right. Nobody looked at them. Three reasons, and they are the reasons most BI reports go unread.

First, it answered at the wrong altitude: a regional head wants to know which of their stores are losing money this month, and had to derive that from a table. Second, it could not handle the access problem — a store manager needs to see their own gross margin percentage but must not see the cost price behind it, and a report that shows margin generally shows cost. So access was restricted, and the people closest to the problem could not see it. Third, nothing in it pushed. It waited to be opened, and a report that waits to be opened gets opened after the quarter has closed.

What I built

Four views over a read-only connection to the finance warehouse, with access decided at the query layer rather than in the interface.

  • An executive summary: gross sales, net sales, gross margin and margin percentage, net profit and net profit percentage, and the count of profitable versus loss-making stores.
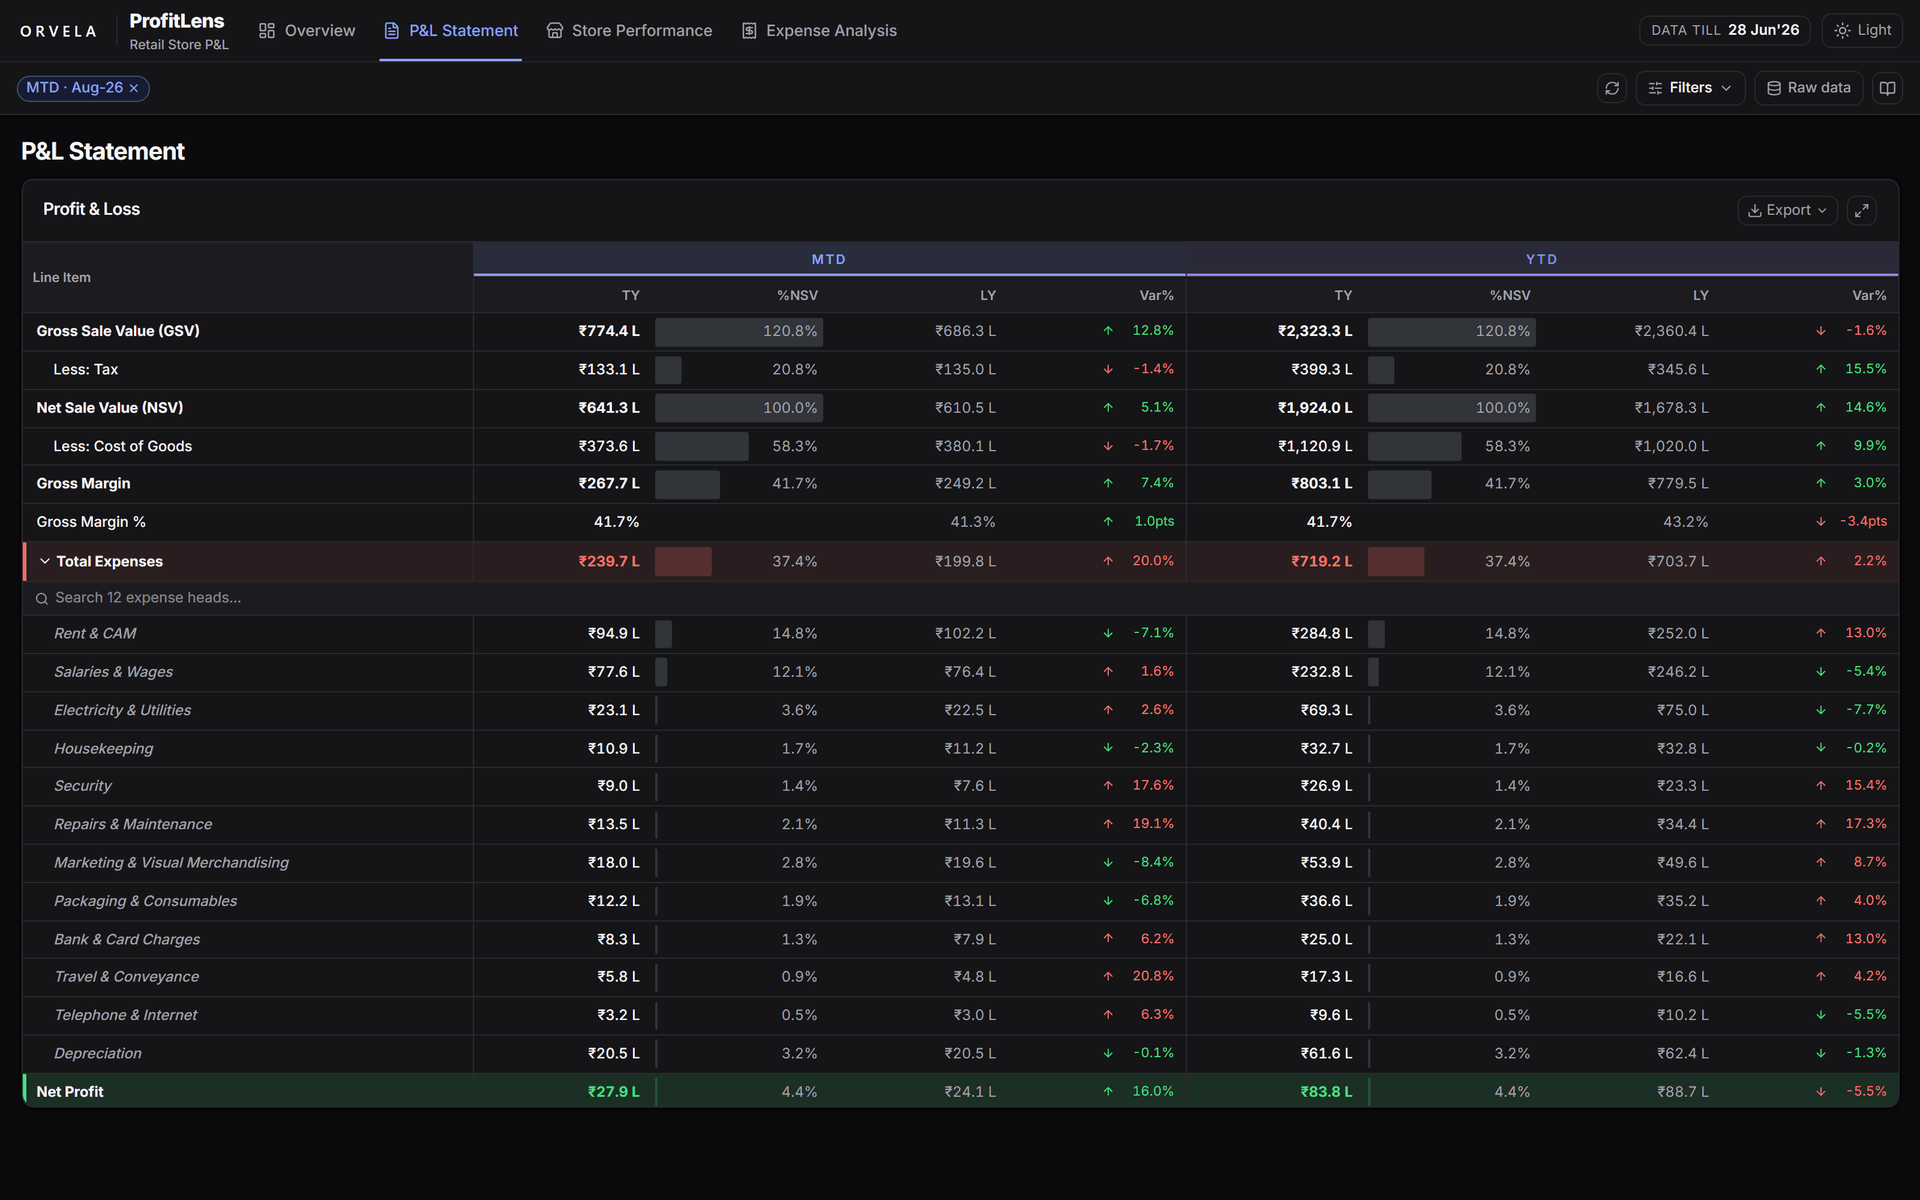
  • A full P&L statement with a profit waterfall running gross sales → tax → net sales → cost of goods → gross margin → expenses → net profit. Seven bars, and you can see which one is eating the month.
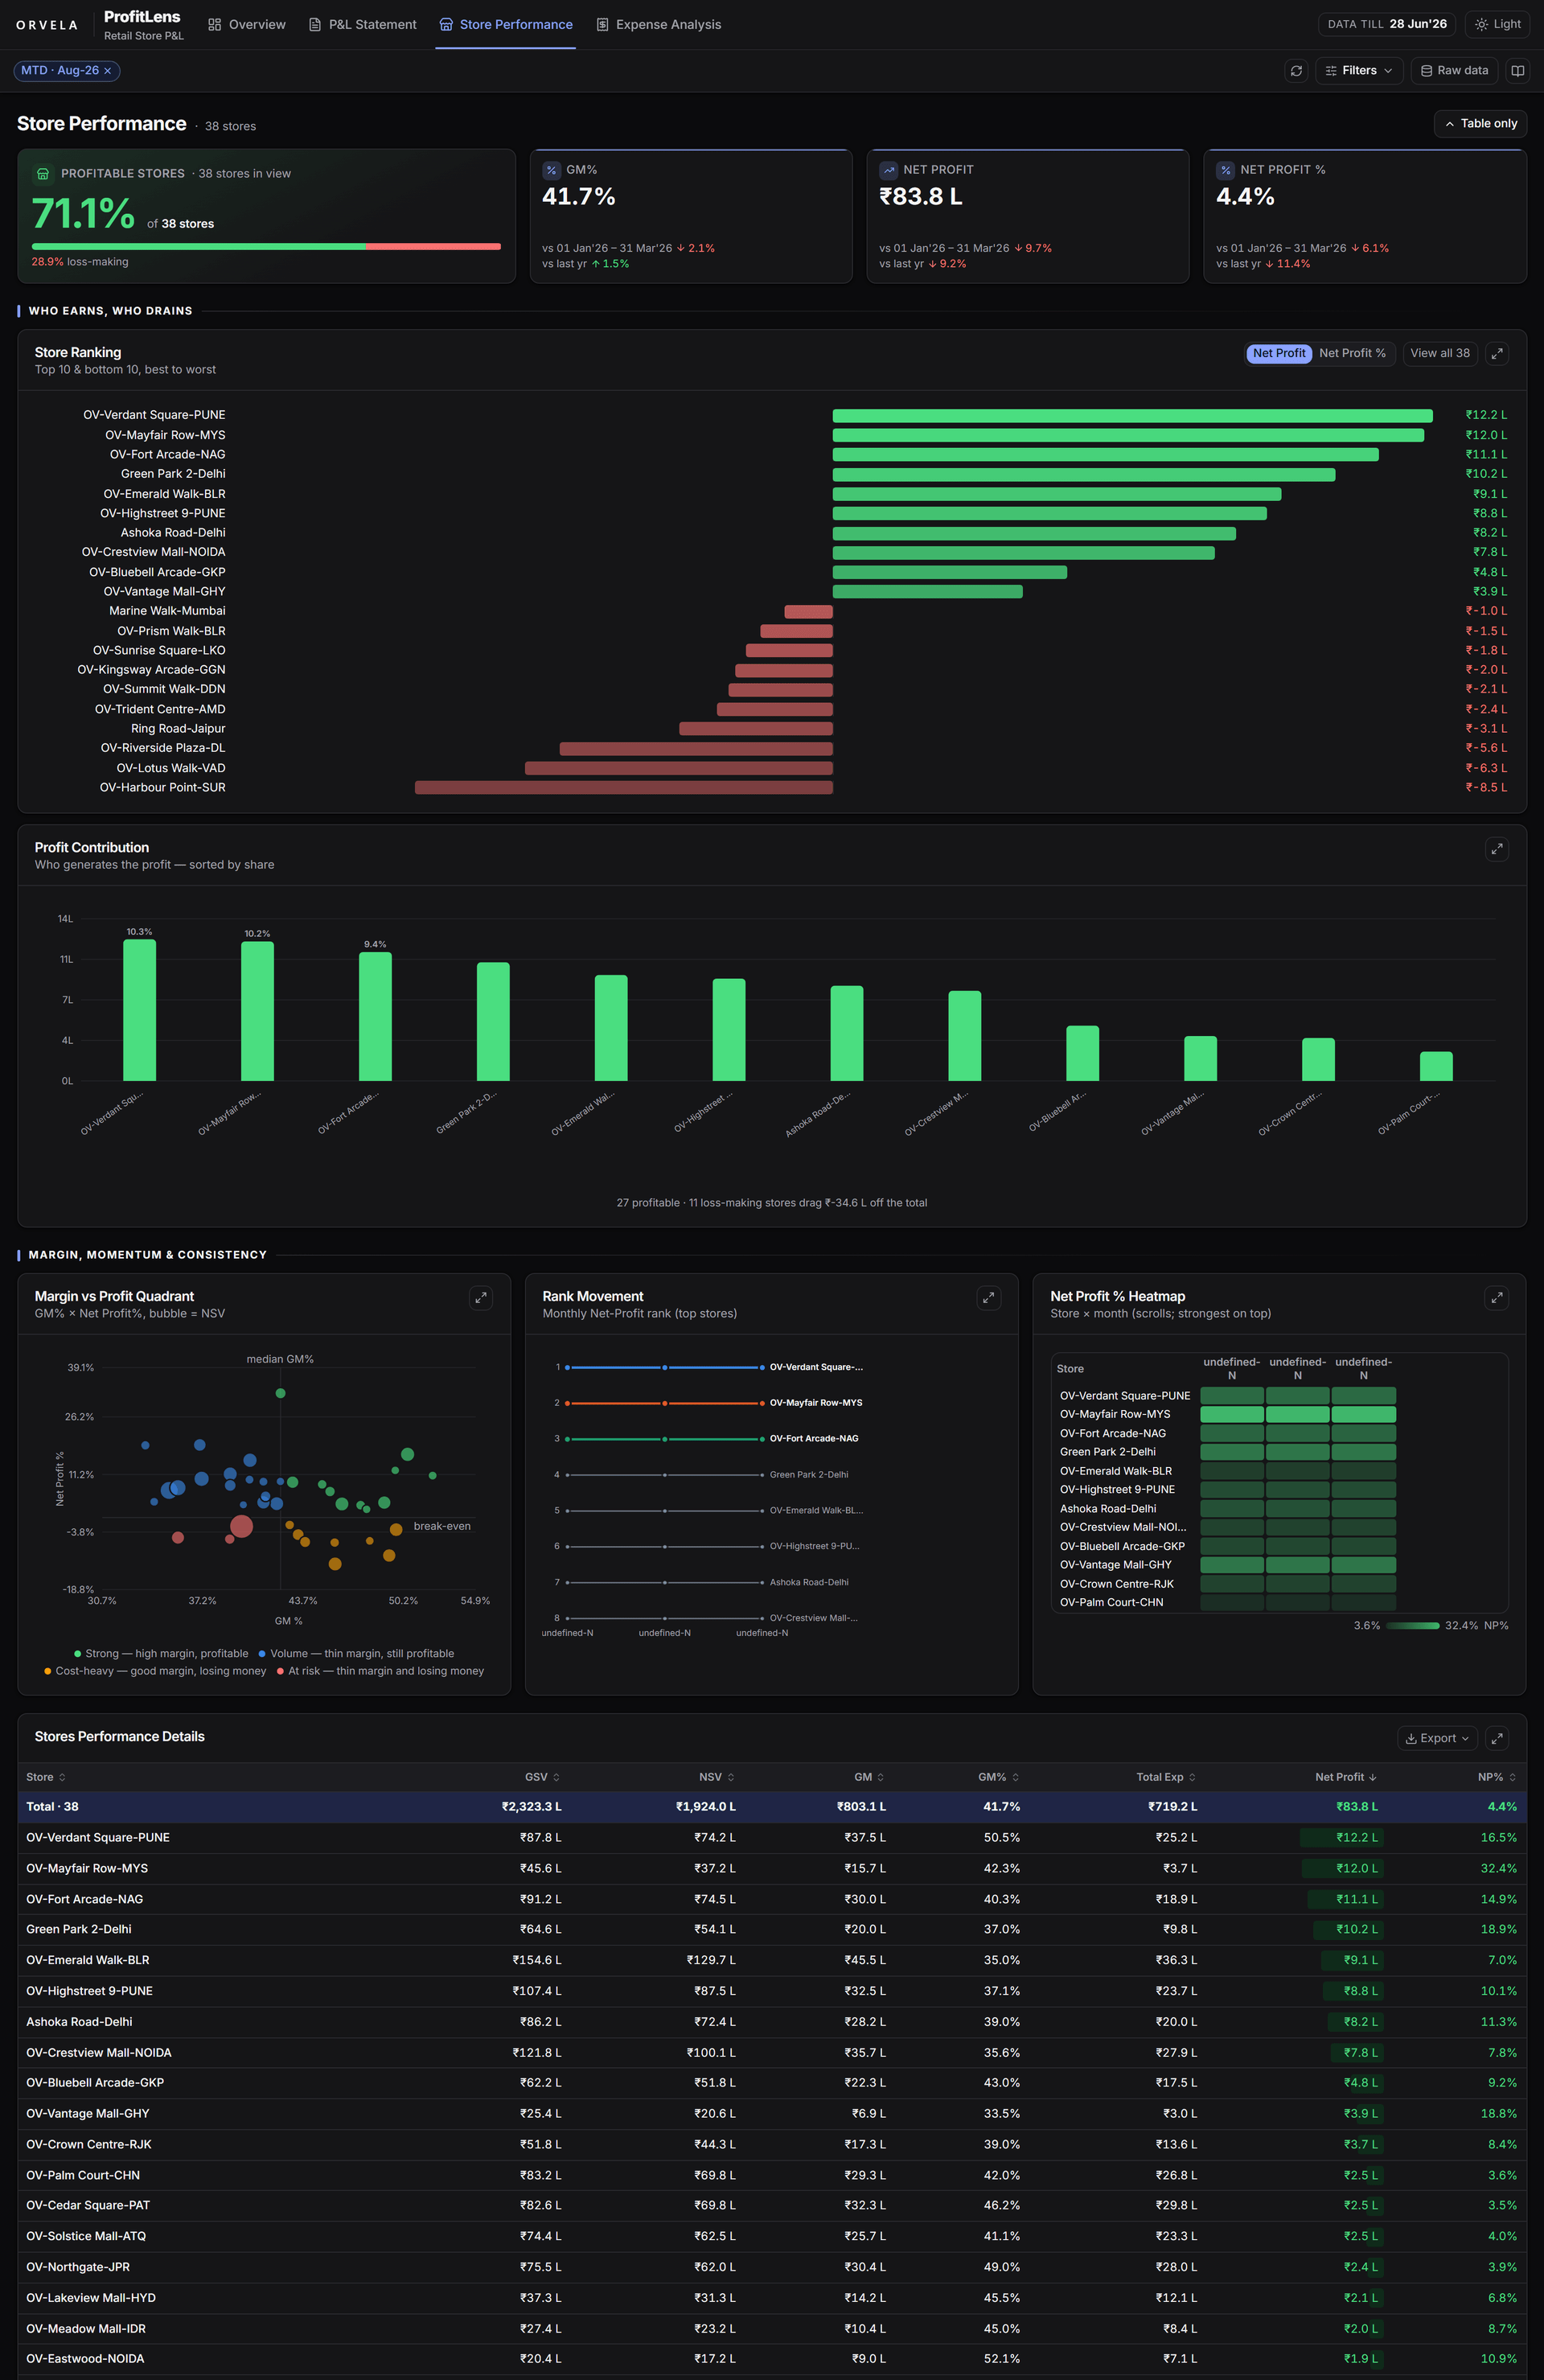
  • Store performance with every store ranked, and the top and bottom ten by net profit called out. The bottom ten is the screen people actually use.
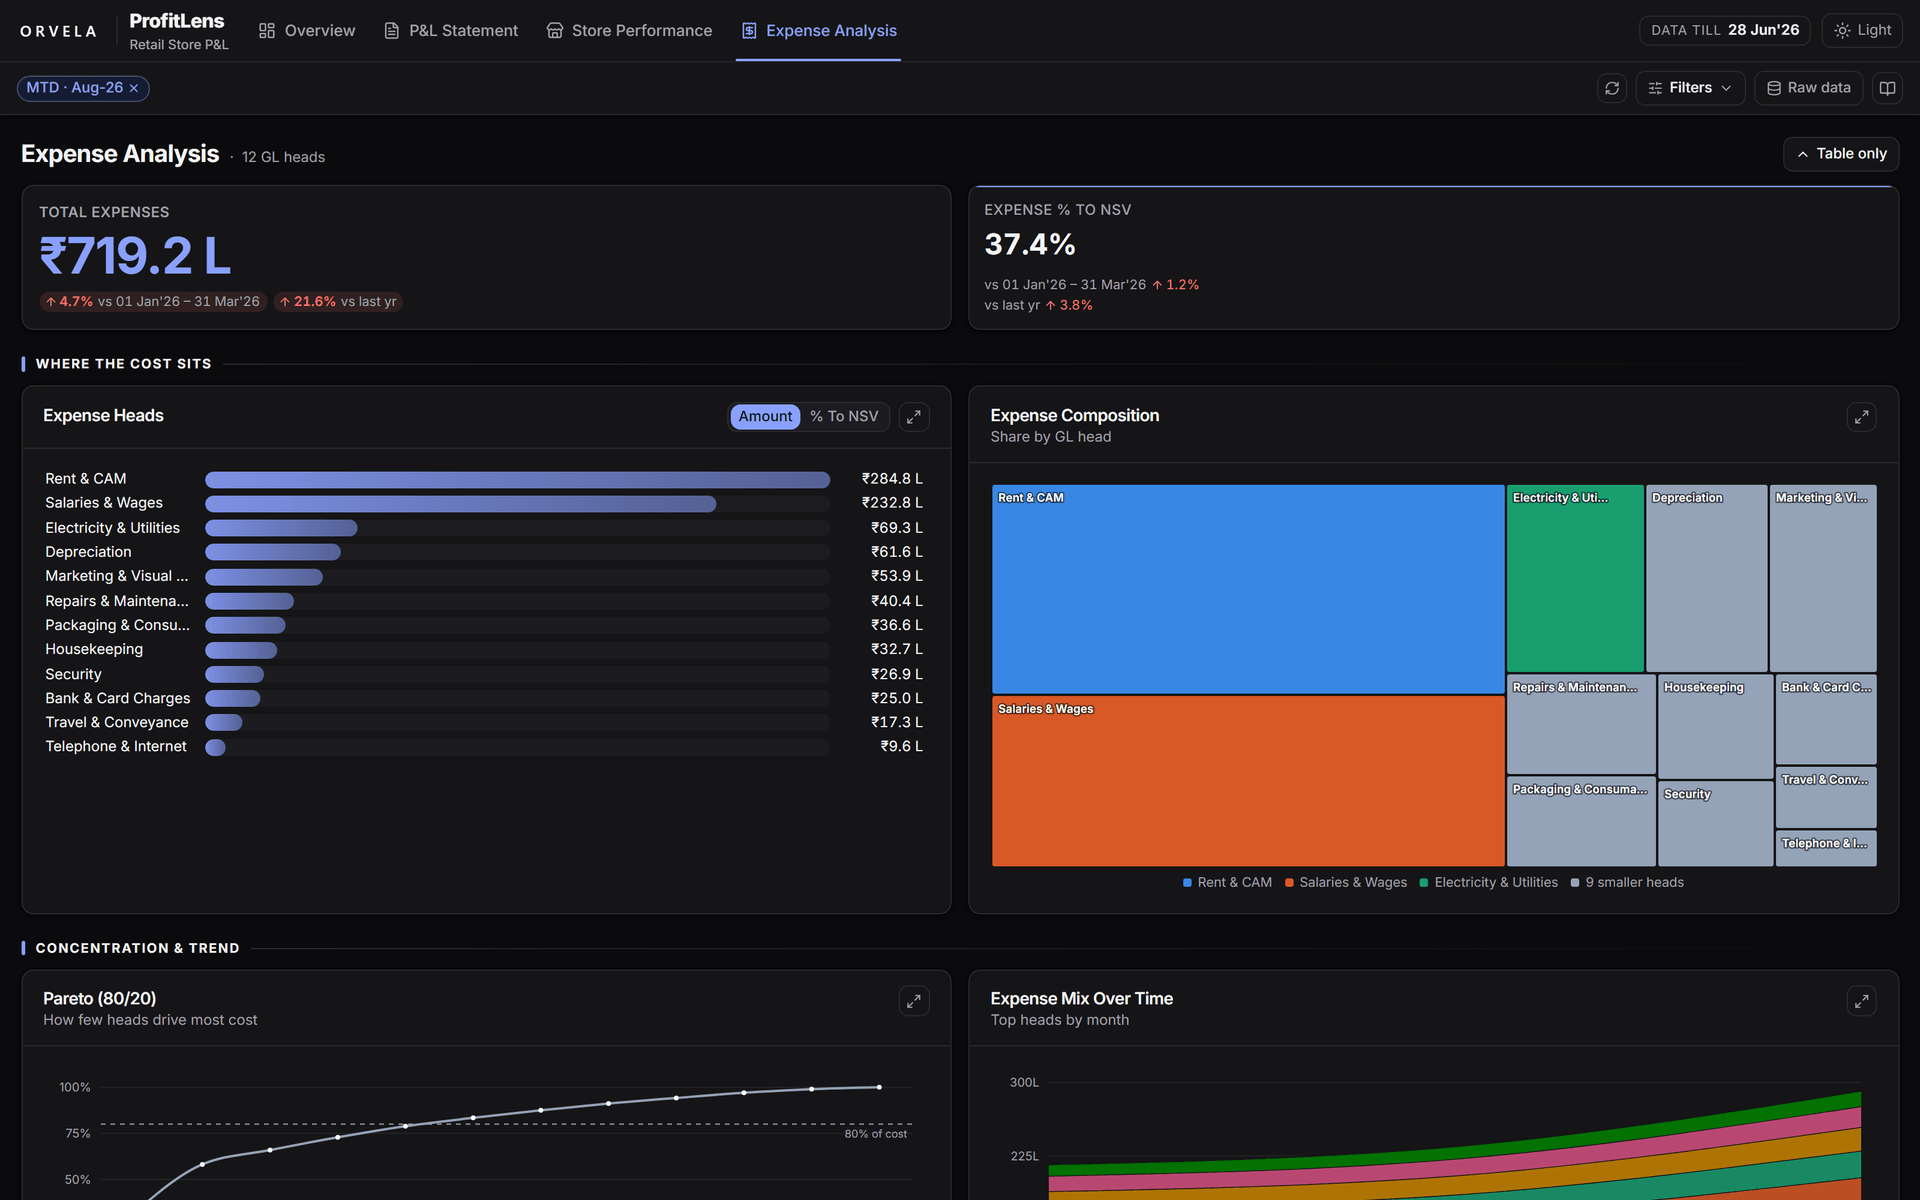
  • Expense analysis broken out and compared period over period, so a rise shows up as a rise rather than as a slightly different total.
  • Key alerts computed automatically rather than configured: loss-making stores, and any store with gross margin under 35%.
  • Row-level access with a cost-visibility flag, so a store manager sees their own store and its margin percentage without ever seeing raw cost.
Full profit and loss statement with a seven-step waterfall from gross sales to net profit.

Swipe to see the full screen

Seven bars from gross sales to net profit. You can see which one is eating the month.
Store performance ranking with top and bottom ten by net profit.

Swipe to see the full screen

Every store ranked. The bottom ten is the screen people actually use.
Expense analysis broken out by head and compared period over period.

Swipe to see the full screen

Expenses period over period, so a rise shows up as a rise rather than a slightly different total.

Decisions worth explaining

The choice, why it was made, and what it means for you. Skip the middle part if you like — the point still lands.

01

Cost visibility had to be enforced where the numbers are computed

The choice

The restriction is applied server-side at the point figures are calculated and serialised, not by hiding a column in the interface.

Why

Gross margin percentage is derived from cost. If a user can see revenue and margin percentage, they can compute cost. “Hide the cost column” is not a solution — the system has to decide, per user, which derived figures are safe to release at all.

What it means for you

This is what allowed the tool to be given to store managers, which is the entire difference between a report that is technically available and one that is actually used.

02

Alerts are computed, not configurable

The choice

Two rules — loss-making, and gross margin under 35% — applied to every store automatically, with no setup.

Why

Configurable alerts are a feature request that becomes an empty screen, because nobody sets them up.

What it means for you

The alerts panel is never empty and never stale, and the conversation about a bad store happens during the month rather than after it.

03

One query per view, computed server-side

The choice

Period-over-period comparison and the waterfall decomposition are computed in single queries rather than assembled client-side from several.

Why

Stitching several queries together is how a report ends up with subtotals that do not sum to its own total, usually because the data moved between queries.

What it means for you

The total at the bottom is arithmetically the same data as the rows above it, and the four tabs stay interchangeable without re-fetching everything.

For the technical readerUnder the hood
  • FastAPI backend against a strictly read-only PostgreSQL connection — the P&L system reads the warehouse and cannot write to it.
  • Next.js and React front end across four tab routes.
  • Row-level security scopes every query by the user’s store allowlist at the query layer, with the cost-visibility flag evaluated server-side so restricted figures are never serialised into a response that reaches the browser.

What it changed

  • The Power BI report was retired.
  • Store P&L became something a regional head opens on a phone and a store manager is permitted to see.
  • The loss-making count and the sub-35%-margin flags are on the first screen every time, without anyone building a view.

Where this applies to you

If you have a BI report that is accurate and unread, the problem is usually altitude and access rather than the numbers. This fits any multi-site business where profitability differs by site and the people who can change it are not the people allowed to see it.

Screenshots show the real interface with sample figures; no client financials appear. 51 stores is the production store count. The 35% margin threshold is the client’s configured rule.

Tell me what’s slow, manual, or unreliable.

Twenty minutes on a call is usually enough for me to tell you whether software is the answer and roughly what it would cost. If it isn’t, I’ll say so.

Available for freelance builds alongside senior engineering work. One or two projects at a time.