Retail operations · 50+ stores

A stock audit tool that was reporting 450 units where there were 218,645

A stock-screening tool had already been built and handed over. It did not add up. I was asked to fix the interface and ended up rebuilding the system around the company’s actual written audit policy. It now reconciles 260,251 lines at a 99.99% barcode match rate.

260,251

reconciliation lines processed in one audit cycle

99.99%

barcode match rate against 334,586 live product codes

₹1.19 crore

variance identified as recoverable

1.7 million

sales lines cross-referenced for the recovery threshold

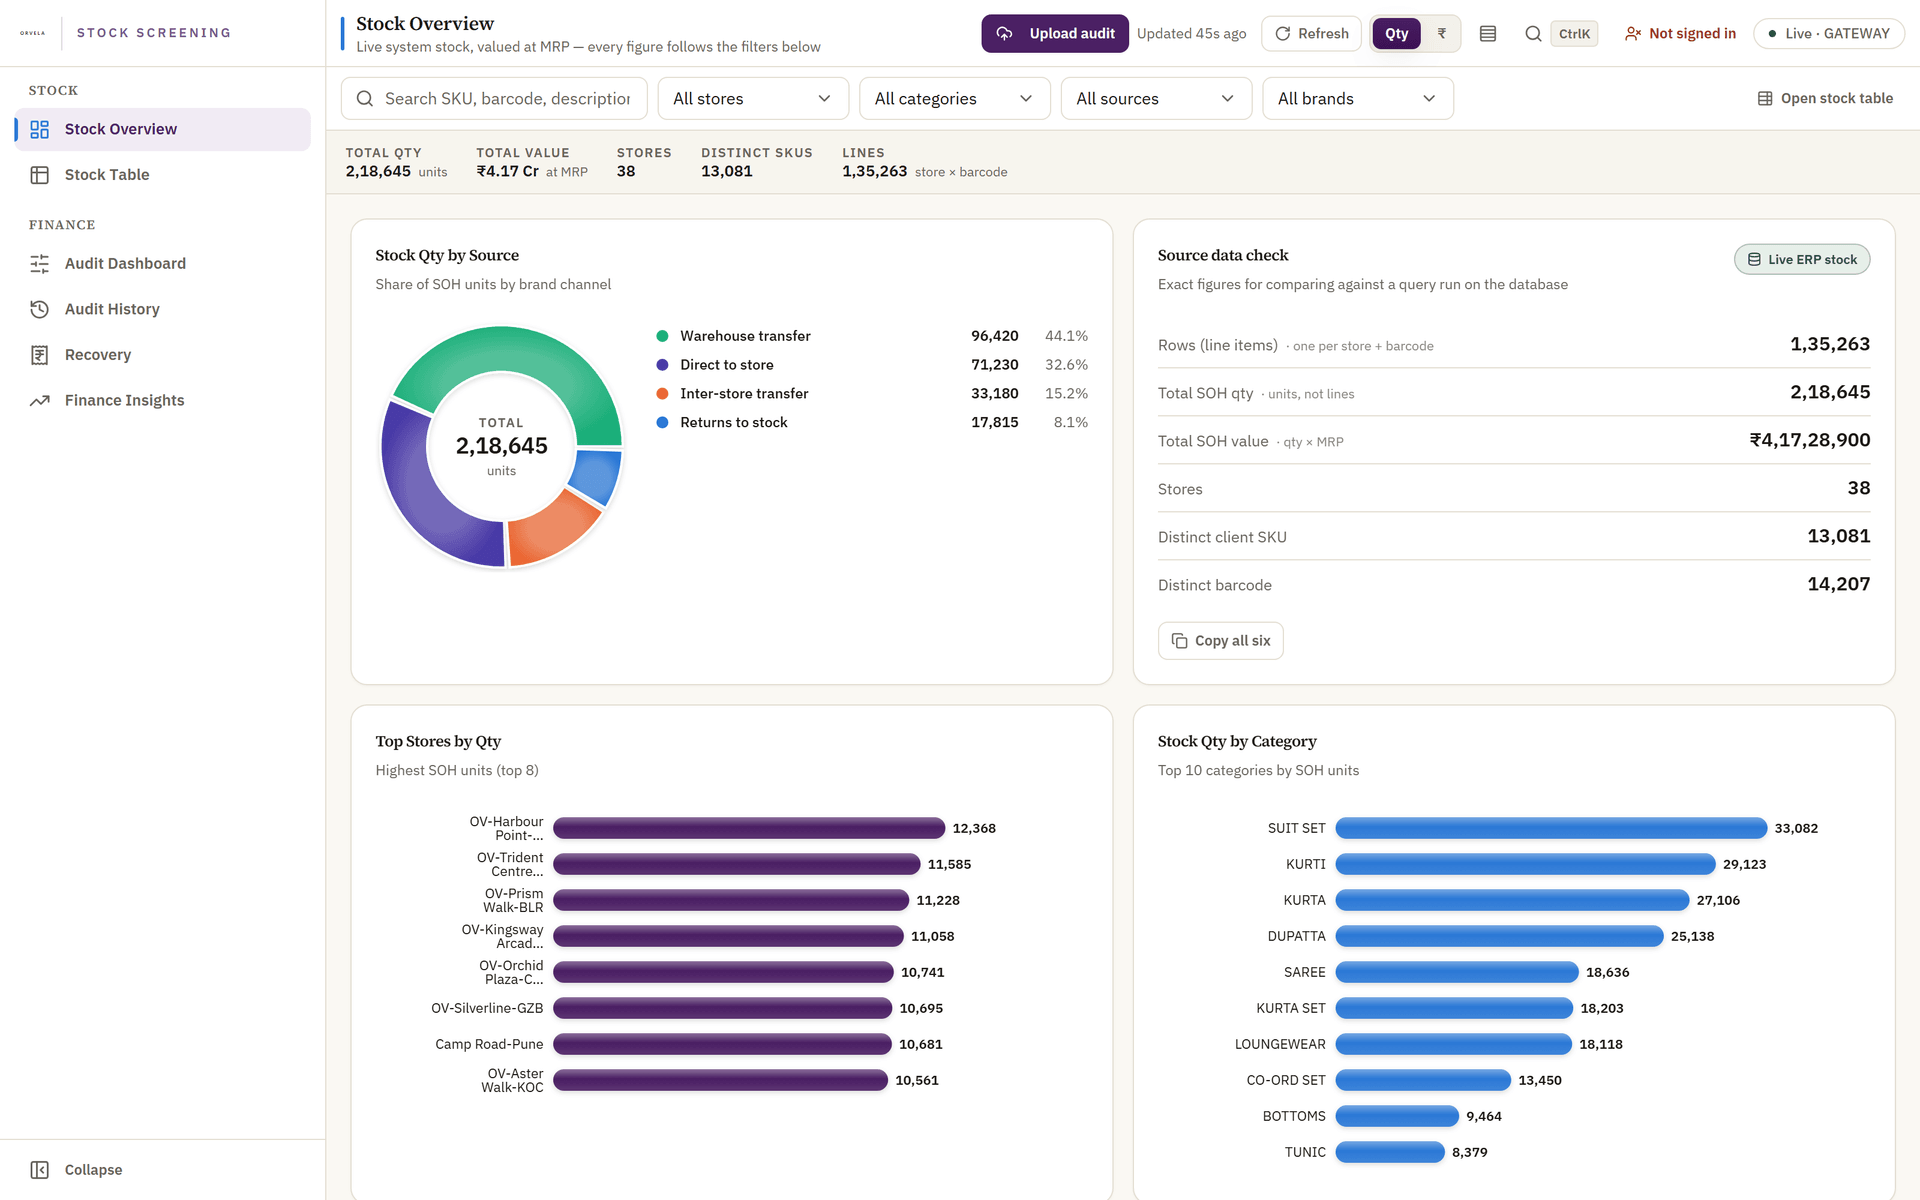
Stock overview with totals by store, brand and category, and a variance distribution chart.

Swipe to see the full screen

Current stock across every store, with the totals reconciling — the thing the previous tool got wrong by 218,000 units.

The situation

A national apparel retailer with more than 50 company-operated stores was running physical stock audits against a tool nobody could trust. The failure was not subtle — the brief that brought me in contained one line that says everything:

“Existing tool showing is 450 qty instead of 218645.”

A stock audit reporting 450 units where there are over two hundred thousand is not a display bug. It means every shortage figure, every recovery decision and every conversation with a store manager rests on a number nobody can defend. In a chain where audit shortfalls are recovered from employees under a written policy, a wrong number is not merely embarrassing — it is unfair to real people, every month.

The company had also just issued a formal stock and cash audit policy with category-specific recovery rules and a materiality threshold, none of which the existing tool implemented. Auditing was happening in spreadsheets, and the spreadsheets disagreed with each other.

What I built

A screening and reconciliation system that reads from the live ERP — read-only, always — and writes to its own audit schema, so audit activity can never touch the source of truth.

  • Stock screening by store, brand, category and barcode, with the totals actually adding up.
  • Template out and count in on one screen: download the count template for a store, hand it over, take the completed file back in the same place. It doubles as a plain stock report, so people who only need stock never enter the audit flow.
  • Ingestion that survives real files — it detects whether the upload is xlsx or csv, finds the row that is genuinely the header rather than assuming the first, and converts Excel’s date serial numbers back into dates.
  • Reconciliation line by line, netted within category exactly as the policy requires, producing shortage and excess separately.
  • The recovery matrix applied automatically: a 40/60 split on the core range and 30/70 on the secondary categories.
  • A materiality threshold set at 0.10% of that store’s sales — which means cross-referencing a 1.7-million-line sales warehouse for every store being audited.
  • Analysis views that let a regional manager identify outlier stores before anyone drives anywhere.
ORVELA

Stocktake

Stock audit & recovery

22 stores

Category shortage

₹74.2 L

Recoverable

₹1.19 Cr

Waived below threshold

₹3.8 L

Stores owing

21 of 22

Recovery by store

Each store's latest count, with the written policy applied line by line

StoreAudit dateLinesCategory shortageSplitRecoverableThreshold
OV-Crestview Mall-NOIDA04 Jun 265,400₹-48,20030 / 70₹14,460Chargeable
OV-Riverside Plaza-DL06 Jun 267,080₹-69,60040 / 60₹27,840Chargeable
OV-Emerald Walk-BLR09 Jun 268,760₹-91,00040 / 60₹36,400Chargeable
OV-Highstreet 9-PUNE11 Jun 2610,440₹-1.1 L30 / 70₹33,720Chargeable
OV-Sunrise Square-LKO14 Jun 2612,120₹-1.3 L40 / 60₹53,520Chargeable
OV-Kingsway Arcade-GGN17 Jun 2613,800₹-1.6 L40 / 60Below threshold
OV-Lakeview Mall-HYD21 Jun 2615,480₹-1.8 L30 / 70₹52,980Chargeable
OV-Northgate-JPR26 Jun 2617,160₹-2.0 L40 / 60₹79,200Chargeable

Shortage is netted within each category, never across — an excess in KURTA never offsets a shortage in SAREE. Recovery applies only above 0.10% of that store's sales in the period.

Swipe to see the full screen

The written policy as code — category netting, the 40/60 and 30/70 splits, and the 0.10%-of-sales threshold.
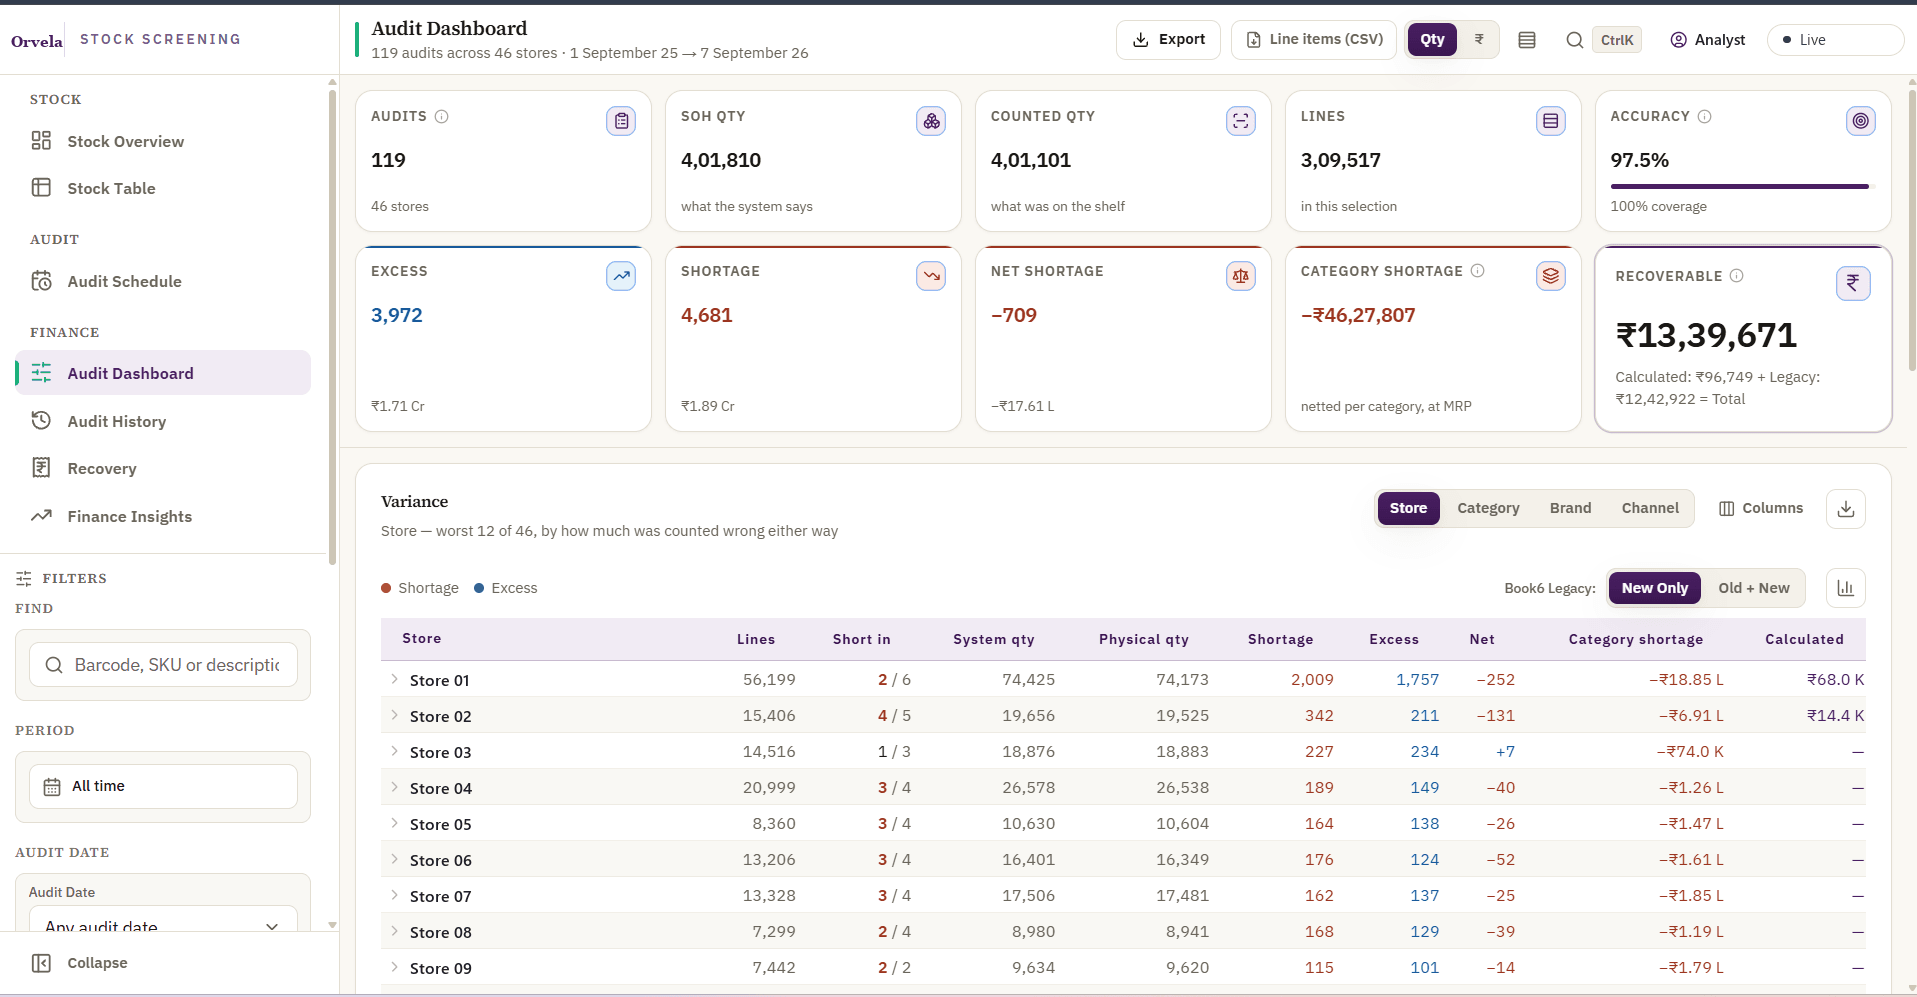
Audit dashboard with audit, stock, shortage and recoverable totals, and a table ranking stores by how far their count was off.

Swipe to see the full screen

119 audits across 46 stores on one screen — and the stores whose counts were furthest off, ranked, so a regional manager knows where to go before they set off.
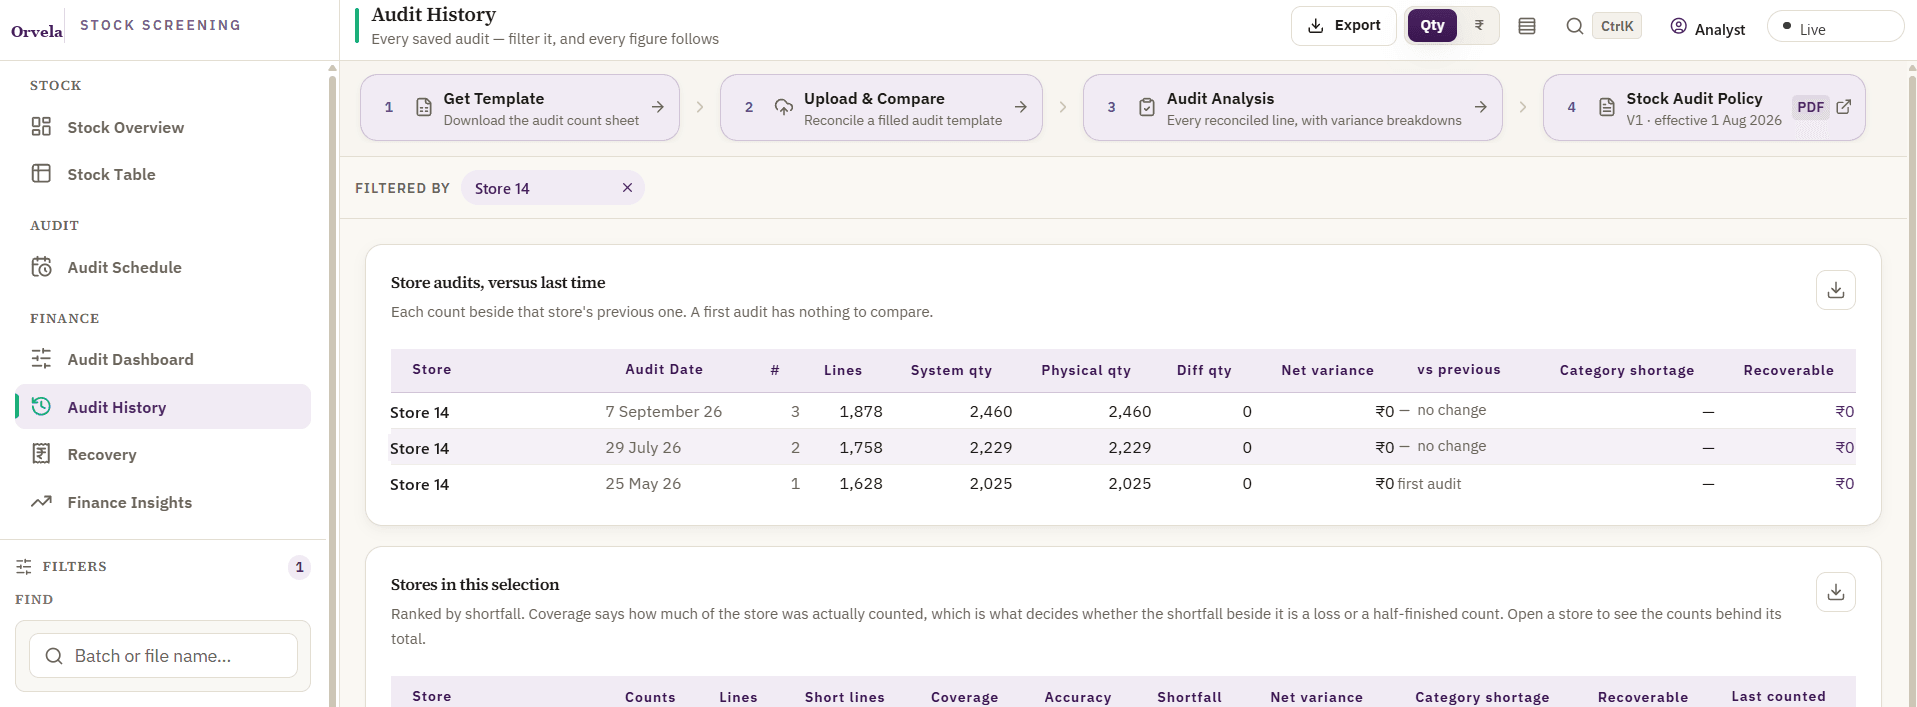
Audit history for one store, listing each count beside the previous one with quantities, net variance and change.

Swipe to see the full screen

Every count beside the one before it, so a store that is improving and one that is slipping look different.
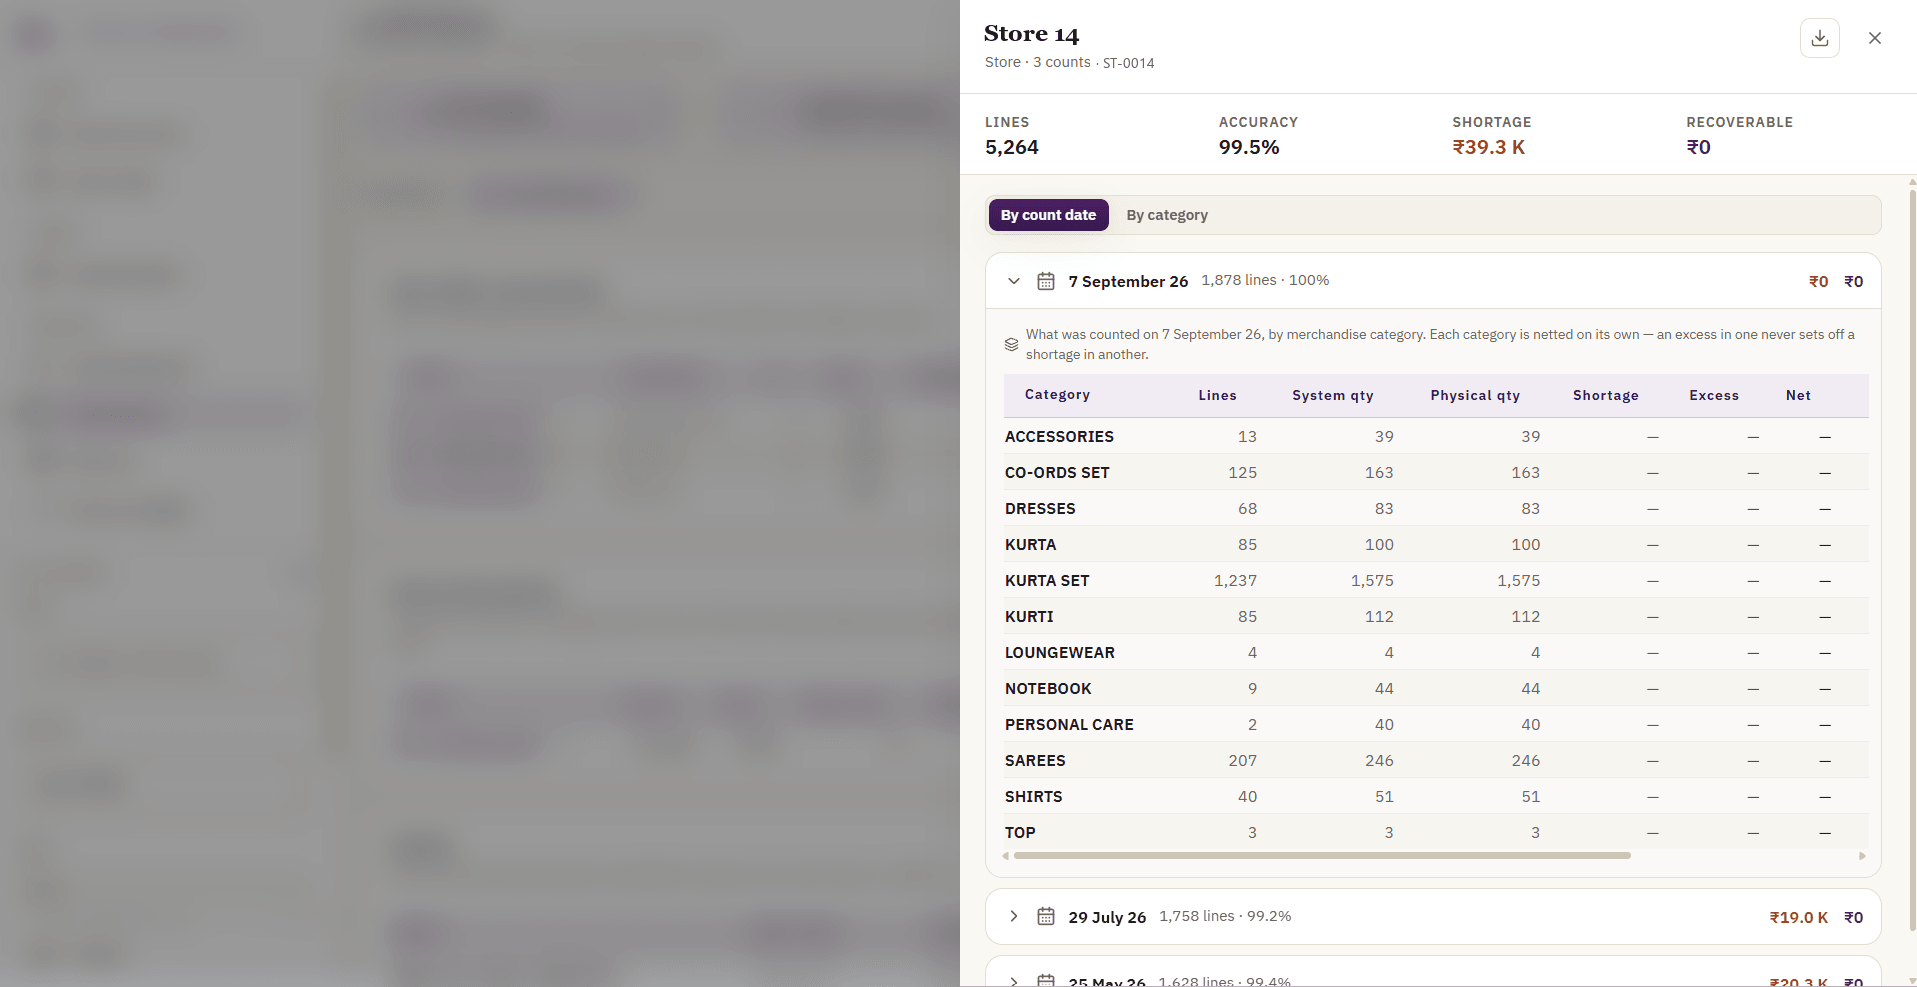
Store detail drawer with lines, accuracy, shortage and recoverable totals, and one count broken down by merchandise category.

Swipe to see the full screen

One store, one count, category by category — each netted on its own, so an excess in one never hides a shortage in another.

Decisions worth explaining

The choice, why it was made, and what it means for you. Skip the middle part if you like — the point still lands.

01

The policy is the specification

The choice

The company had a written audit policy covering category netting, who bears what share of a shortfall, and when recovery applies at all. The code implements the document, clause by clause.

Why

Most tools implement somebody’s memory of a policy, or a finance team’s spreadsheet formula that behaves differently depending on who opened it last.

What it means for you

Every store is treated identically every month, and when the policy changes, exactly one place changes.

02

Netting, in the right order

The choice

Shortage and excess are netted within a category and never across it, and the discount split, category netting and materiality threshold are applied in a fixed sequence.

Why

The naive approach sums every shortage and every excess and reports the difference. That is wrong: an excess of 200 units of one item does not compensate for a shortage of 200 of another, and it hides real loss. Change the order of operations and the recovery number changes.

What it means for you

The recovery figure means the same thing in every store, every cycle — which is what makes it arguable in a review rather than merely assertable.

03

Read-only on the source; the app owns its own schema

The choice

The ERP connection cannot write. Audit state lives in a separate schema owned by the application.

Why

An audit system that can edit the stock it is auditing is not an audit system.

What it means for you

Running an audit can never damage live inventory, and the audit trail is separable and exportable.

04

The match rate is the product

The choice

Matching effort went into the barcode join before anything else, and the match rate is displayed next to the recovery figure every time.

Why

Everything depends on the barcode on the count sheet being the barcode in the ERP, and real chains have discontinued codes, re-used codes and hand-typed ones.

What it means for you

99.99% against 334,586 live codes across 260,251 lines is what makes the recovery figure something a finance head will sign rather than argue with. If matching drops, the figure is visibly suspect.

For the technical readerUnder the hood
  • Next.js + TypeScript + Tailwind + shadcn/ui front end, with TanStack Table for the reconciliation grids and Recharts for the analysis views.
  • Filter state lives in the URL, so an auditor can send a colleague a link to exactly the view they are looking at.
  • Express + TypeScript backend using raw parameterised SQL throughout. No ORM: the reconciliation queries are the product, and hiding them behind an abstraction made them harder to reason about and slower. Parameterised statements keep the readability without the injection risk.
  • Two databases — the live ERP connected read-only, and an application-owned audit schema holding uploads, reconciliation runs and results. That boundary is enforced by credentials, not by discipline.

What it changed

  • Audits moved off spreadsheets onto one screen with one number.
  • The recovery figure is now computed from a stated policy, reproducibly, with its match rate shown alongside — so when a store manager disputes a shortage, the conversation is about the count, not about whether the tool works.

Where this applies to you

If you run more than about ten stores and your audits happen in Excel, you already have this problem — you just do not have a number for its size yet. The same system fits anywhere a physical count has to be reconciled against a system quantity and money follows from the difference: stores, warehouses, distributors, franchise networks.

Screenshots show the real interface with sample figures; no client data appears. The ₹1.19 crore figure is the recovery the system computed for one audit cycle under the client’s stated policy — a calculated exposure, not collected cash.

Tell me what’s slow, manual, or unreliable.

Twenty minutes on a call is usually enough for me to tell you whether software is the answer and roughly what it would cost. If it isn’t, I’ll say so.

Available for freelance builds alongside senior engineering work. One or two projects at a time.